Metric 1. Disqualification rate
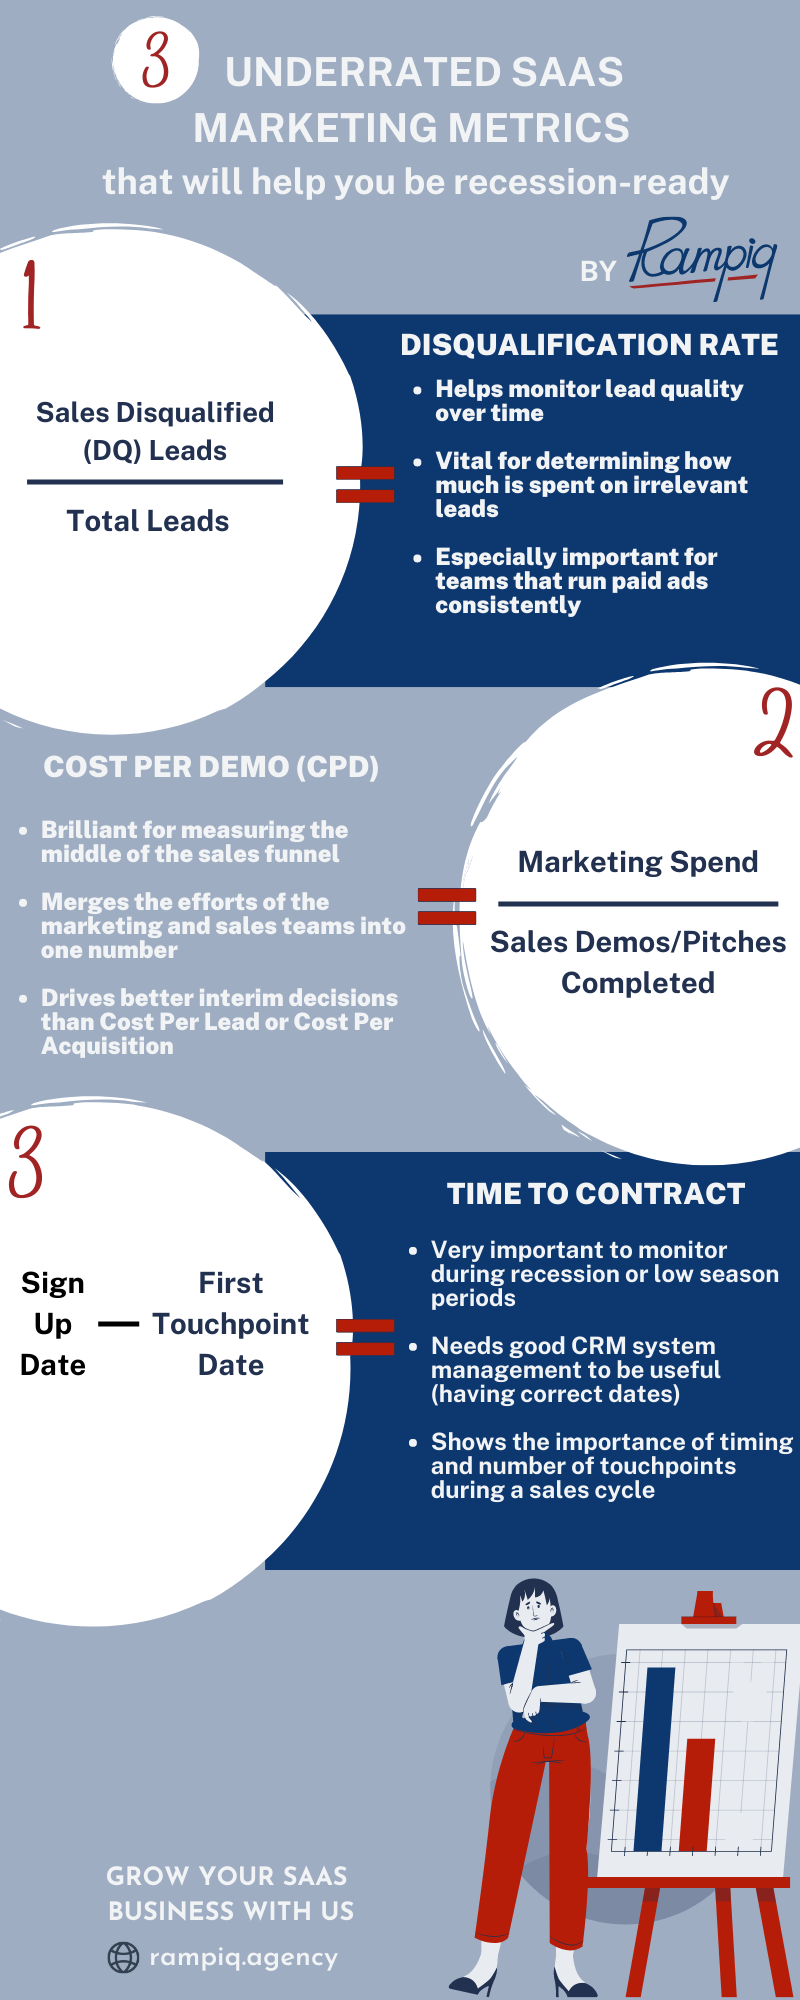
The disqualification rate is the ratio of sales of disqualified leads divided by the total amount of leads you’ve got for a period of time.
Here’s the formula to calculate Disqualification Rate:

Disqualification Rate = Sales DQ Leads / Total Leads
While many SaaS businesses are looking at the Cost per Lead, Cost per Acquisition, not all of them are looking into Disqualification Rate as the factor that determines where they are actually losing money.
We saw a lot of SaaS businesses fighting for lead quality and this is natural, everybody wants to get as many sales-qualified leads as they can.
However, what usually was missing in the picture is the Cost per Disqualified Lead.
Disqualification rate is the metric that will help you determine over time how you are doing in terms of not wasting your budget on the leads that your sales team is repeatedly disqualifying.
And it is a simple metric to look at, it’s a percentage and you can calculate it straight away for a given period. You just need to know the total lead numbers and how many leads were qualified and how many were disqualified.
Also, we saw Disqualification Rate being an effective KPI for marketing campaigns especially when you are spending money consistently on Paid Ads. By decreasing your Disqualification Rate you are setting the right expectations from your marketing team (or an agency, or a person who is managing your ads) because all of you start looking in the same direction.
You do not want your Disqualification Rate to be through the roof, you want to bring it down. And it’s very easy to monitor, it’s easy to calculate, and it’s easy to assess how you are doing with the quality of your leads when you monitor your Disqualification Rate on a regular basis, and you see it is declining.
Metric 2. Cost per Demo
The second metric to track in order to help your SaaS company be more recession-ready is the Cost per Demo.
How do you calculate the Cost per Demo?

Cost per Demo = Marketing spend / Demos completed
There are a lot of cost metrics associated with SaaS products. You can measure the Cost per Acquisition, you can measure the Cost per Lead, but what we saw most effective as the metrics to monitor on a regular basis is the Cost per Demo.
It’s super easy to calculate: you take your marketing spend for a period and divide it by the amount of demos completed.
Why Cost per Demo?
A Demo sits in the middle of your funnel and you need to know exactly how much money it cost to bring somebody on the call with your salesperson.
You can still measure more top-of-the-funnel metrics such as Cost per Lead or you can measure more bottom-funnel metrics like Cost per Acquisition.
However, Cost per Demo is a great interim metric to have in your SaaS business simply because it merges the effort between the marketing team and the sales team into one single metric that you monitor regularly and you can see how much it costs to bring somebody on the call with your team.
We’ll be blogging more about marketing and sales aligning metrics a little bit down the road, but Cost per Demo is a great metric to monitor how your marketing effort is helping your sales team to get more business closed.
Metric 3. Time to Contract
The third metric is the Time to Contract is also a SaaS productivity metric. The formula is super simple: you get the first touchpoint date, which could be the lead’s creation date in the SaaS CRM, and you get the conversion date, i.e. the date when somebody actually signed up for your product and thus made a contract with you.
How do you calculate the Time to Contract?

Time to Contract = Sign up date – First Touchpoint date
The sales cycle for B2B companies is usually extremely long. As it becomes longer and longer, the more economy goes into recession mode.
Monitoring these timing metrics is extremely important in Q3 and Q4 of 2022 part in particular because this is something that you would like to know and manage better during tough times.
The timing metrics are a bit tricky to use and assess, however, they can bring a lot of insights into your cash flow and marketing budget planning, as you can forecast much better knowing your sales cycle stages in this very detail.
There is a lot of research about the number of touchpoints, the number of days, and how long overall it takes for the prospect to convert, and recently the SaaS companies tend to have even longer sales cycles than ever.
Monitoring your Time to Contract regularly will greatly help you with your budgeting and resource alignment.

