This guide will explain all the B2B SaaS metrics that matter for your business. The SaaS business model is unique and it drives a multi-billion dollar market segment, growing year over year. To manage this growth effectively, more and more SaaS companies adopt a culture of tracking the most important metrics in the following business areas:
Monitoring these metrics enables SaaS companies to optimize their marketing strategies to attract and retain customers, and ultimately drive revenue growth.
This guide to the most important B2B SaaS metrics explains how SaaS founders, executive teams, and industry professionals can use them to track, measure, and facilitate growth.
On the one hand, marketing products traditionally have always involved finding audiences and convincing them about your product to turn them into paying customers.
SaaS companies, on the other hand, are data-driven, and they use this data to study their market toachieve product-market fit. Many SaaS companies go to the extent of creating new categories to effect this.
Decision-makers – Software as a Service (SaaS) Founder-CEOs, Co-founders, and CMOS – need to keep a close eye on the following marketing metrics when it comes to tracking the healthy growth of a company. Marketing for SaaS is similar in principle but way different in practice, especially regarding their marketing strategies, channels, and metrics to measure.
SaaS companies spent tons of money to acquire data about existing and potential customers, company productivity, marketing successes, and much more. To use all of this data to affect growth in your business, you must evaluate them, and this is why you need to track the right metrics.
In this SaaS metrics cheat sheet, we will focus on SaaS metrics that matter most in 2026, as the post-pandemic business landscape brought new challenges to the market.
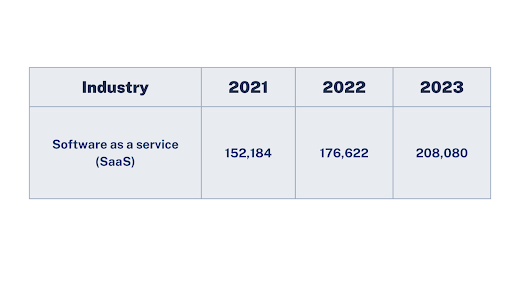
Worldwide Public Cloud Services End-User Spending Forecast (Millions of U.S. Dollars)
SaaS remains the largest public cloud services market segment, forecasted to reach $176.6 billion in end-user spending in 2022.
Gartner expects steady velocity within this segment as enterprises take multiple routes to market with SaaS, for example via cloud marketplaces, and continue to break up larger, monolithic applications into composable parts for more efficient DevOps processes.
Software as a service is one of the most sought-after business opportunities. People looking for their next career role or their next business venture can develop valuable skills and knowledge in this fast-moving industry.
Key Metrics for SaaS Companies to Understand to Drive SaaS Business Growth
SaaS/subscription businesses are more complex than traditional businesses. Common SaaS business metrics totally fail to capture the key factors that drive SaaS performance. In the SaaS world, there are a few key variables that make a big difference to future results. This guide is aimed at helping SaaS executives and industry professionals understand which variables really matter, and how to measure them and act on the results.
“If you cannot measure it, you cannot improve it”
– Lord Kelvin
This brings us to the topic of SaaS metrics. Business owners tend to focus on these metrics, as they give you insight into the retention and churn rates of your SaaS company.
The primary aim of measuring SaaS business metrics is to turn them into KPIs (Key Performance Indicators). You can know the direction your business is going when you keep track of the metrics we will discuss in this section.
All SaaS businesses strive for growth, however, growth is impossible to achieve without measurement and looking at the right metrics from the right angle.
From our conversations with SaaS CEOs and founders, here are the key challenges they face when it comes to growth and results measurement:
Not knowing which exactly metrics to track and monitor, and which ones send alarming signals;
Interpreting the metric correctly in application to their business;
Not understanding what actions should follow post-measurement to facilitate growth, basically, not being able to turn the findings into the correct set of actions.
The questions SaaS CEOs and founders often have on their plate:
Is my business financially viable?
What is working well, and what needs to be improved?
What levers should management focus on to drive the business?
Should we hit the accelerator or the brakes?
What is the impact on cash and profit/loss of hitting the accelerator?
The main purpose of this guide is to help you answer these questions and tackle the mentioned challenges effectively.
Which B2B SaaS Metrics Should I Focus on Improving?
As long as you are tracking your performance (as you should),B2B SaaS marketing metrics are incredibly significant for quantifying the performance of your campaigns.
As Paul Graham, of Y Combinator, says:
“Startups are so hard that you can’t be pointed off to the side and hope to succeed. You have to know that growth is what you’re after. The good news is, that if you get growth, everything else tends to fall into place. Which means you can use growth like a compass to make almost every decision you face.”
The primary aim of measuring B2B SaaS marketing metrics is to turn them into SaaS KPIs (Key Performance Indicators). You can know the direction your business is going when you keep track of the metrics we will discuss in this section.
As a SaaS company, you can record tons of metrics, but here are the most important ones you must know. You may navigate this SaaS metrics cheat sheet and jump to a section by clicking on any of the metrics below:
In a rush? Download the SaaS Metrics Cheat Sheet as a PDF by filling out the form below.
Without further ado, let’s dive in and discuss all the above metrics and the value they bring to SaaS decision-making process.
1) Revenue Metrics
Revenue metrics are key metrics for SaaS companies to effectively evaluate how their funds are spent and discover ways to optimize spending for achieving business goals. Knowing how much you spend to get new customers is crucial, but keeping track of the revenue you make from each customer is equally important.
In this chapter, we will discuss the key SaaS revenue metrics known as MRR, ARR, and ARPA.
MRR (monthly recurring revenue) is the total revenue generated by a company in a single month. Since SaaS companies mostly follow a subscription-based business model, it is quite simple and straightforward to track and measure the monthly revenue, by simply adding up what customers are paying every single month.
This is an important B2B SaaS marketing metric that is most likely to increase over time. Bear in mind that some customers will pay for multiple months or annual subscriptions which is why you need to understand another important revenue metric – ARR (explained below).
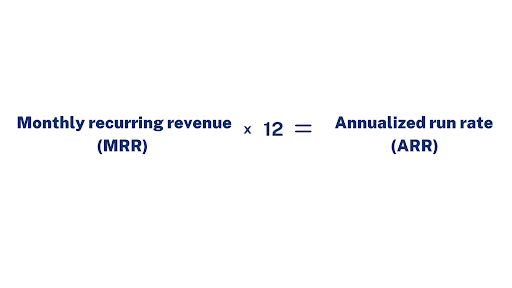
Annualized Run Rate (ARR)
Annualized Run Rate (ARR) also known as Annual Recurring Rate, is the yearly version of Monthly Recurring Revenue (MRR). Annualized Run Rate helps SaaS companies to predict the yearly revenue, based on the actual monthly performance.
Annualized run rate is calculated as follows:
While calculating the ARR, it is generally assumed that there were no changes for the rest of the year such as no new customers, no churn, and no expansion.
However, when it comes to working out the ARR, as outlined above, it’s not quite as simple as the monthly figure x12, as the CEO of Buffer explains:
“The way we’ve measured “Revenue” has been to take the total revenue we generated in the month and use that. For “Annual revenue run rate,” we simply multiplied monthly revenue by 12. Our revenue includes people who pay us monthly and also those who pay for the whole year in advance. This is where the miscalculation lies. As a recurring revenue (SaaS) business, we can’t guarantee we will get the same number of people paying for annual subscriptions month after month, and we are counting revenue that is in the future. The correct way is to ‘amortize’ and divide those annual payments by 12. In this way, we’re only counting the next 12 months of actual recurring revenue we have already acquired.”
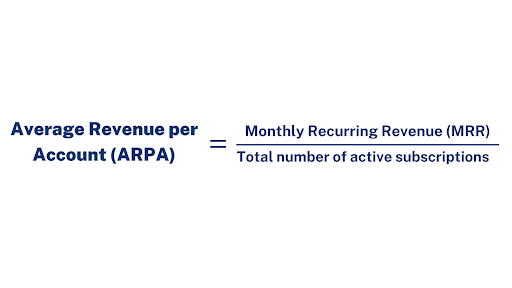
Average Revenue Per Account (ARPA)
You can derive the ARPA by dividing the monthly recurring revenue (MRR) by the total number of active subscriptions. The ARPA tells you is the source of revenue increase or reduction – is it from increased revenue per account or simply more users?
If your SaaS business subscription model generates revenue monthly, you can analyze the ARPA or MRR (monthly recurring revenue) of a single month. Whereas, if it’s annually or quarterly, data from a single month would be insufficient; you need to focus more on the ARR (annual recurring revenue).
If you want to gain insights into the value of your customers and user segments, you would need Average Revenue Per Account (ARPA) to track the average revenue per user.
With this data, you can focus on the highest-value customers and formulate strategies to improve the value of the other customer segments.
The Average Revenue Per Account (ARPA) metric will not give you specific information about your customers, however, it can be used for segmentation and reporting.
Average Revenue Per Account also gives you more clarity on the source of the increase or decrease in revenue. ARPA helps you to understand if the revenue increased due to the improved value per customer or simply from new users.
Growing Your SaaS Business Using Revenue Metrics
If the subscription model of your SaaS business generates monthly revenue, you have to analyze the Average Revenue Per Account (ARPA) and Monthly Recurring Revenue MRR for each month.
However, if your SaaS subscription model generates revenue quarterly or annually, the monthly data can be insufficient or inaccurate – in this case, you need to focus on analyzing the Annual Run Rate (ARR).
MRR (Monthly Recurring Revenue) and ARR (Annual Run Rate) are the major indicators for your SaaS business growth, while Average Revenue Per Account (ARPA) will help identify the reasons behind the fluctuations in MRR and ARR.
Are you wondering why your SaaS business is not growing? Or why are your ARR and MRR static or declining?
It could possibly mean that you are not acquiring enough users. Your SaaS business requires a good investment in the product marketing and sales ecosystem in order to grow and expand.
To grow your SaaS product, you need to start by identifying the pain points in your SaaS business. During the early stages, many SaaS businesses suffer due to the lack of processes and workflow automation, while many others have inefficient product-marketing or sales strategies, or have no coordination between the marketing and sales departments.
For most SaaS startups, lack of transparency and coordination between sales and marketing teams is the most common issue when it comes to scaling the business. However, you may also have other unique problems that may occur based on the nature of your SaaS business.
Once you’ve identified the pain points, you are one step closer to your business growth. All you need is a clear road map to solve the problems and establish proper workflows to streamline your SaaS business growth.
What’s Next? – You need to set goals.
Many successful businesses are using the OKR concept, which means “Objectives and Key Results”.
OKR is an effective goal-setting framework that helps you establish measurable goals in order to grow your business and drive your company toward success. Your “objectives” are the goals that you want to achieve, whereas the “key results” are the KPIs and key metrics that you need to measure your progress toward achieving your objectives. The OKR framework is currently used by some of the world’s leading businesses to deploy their business strategies.
Once you have identified the pain points (key issues), developed a road map, and established your goals and milestones, you are on the right track – you are fully geared up for success. Now, it’s time to execute!
2) SaaS Business Health Metrics
In this section, we will discuss advanced SaaS metrics to monitor the health of your SaaS business. These advanced SaaS metrics will help your business stay competitive and sustained in the market.
Contracted Annual Recurring Revenue (CARR)
Contracted Annual Recurring Revenue (CARR) is revenue from subscriptions for a given period (calculated as an annual run rate) for all the contracts including the ones that were signed in the same period.
CARR is different from ARR (Annual Run Rate) for two main reasons:
First, CARR includes the Annual Run Rate (ARR) of all the new customers that may not be active or live users because their onboarding is not completed yet. For many SaaS products, it may take some time to get the customers onboard (also known as TLL or Time to Live).
Time to Live (TLL) may depend on the onboarding efficiency of taking new customers but it also depends on the customers’ end – in terms of commitment, preparedness, and response which generally causes a lot of delays. Therefore, the TLL metric cannot be entirely controlled, and this is why CARR is a more accurate KPI to track subscription revenue.
Second, using the CARR metric can help you avoid the step function changes in ARR (which are directly linked with TLL). The subscription revenue cannot be recognized until the customer is onboarded and live, the data of which is called the “Go Live” (that meets the international accounting standards (GAAP/IFRS) revenue recognition criteria).
Generally, the contract doesn’t contribute anything to the actual revenue until the period of Go Live data, and during this time, all the monthly revenue is recorded in the “deferred revenue.”
Then, at the time of Go Live data, all the “deferred revenue” are booked for the respective contracts, thus increasing the monthly subscription revenue for the customer, based on the months of the “deferred revenue”. And in the following subsequent period, the revenue drops back to the “actual” monthly subscription revenue.
For example, a new customer with an ACV (annual contract value) of $120,000, requires a three months long onboarding (or TLL). Since the revenue will NOT be recognized unless the customer is fully onboarded, the customer will have zero revenue for the first three months.
In the fourth month, $40,000 will be recorded, and from the fifth month onwards the revenue would be $10,000 for all subsequent months.
This type of revenue fluctuation causes volatility in the ARR metric, and this is why the CRR metric is the preferred metric for enterprise SaaS subscriptions.
Committed Monthly Recurring Revenue (CMRR)
Committed Monthly Recurring Revenue (CMRR) is somewhat related to CARR but they are two different concepts. CMRR, is the Monthly Recurring Revenue (MRR) that includes contracts that are greater than one month. In simpler words, total subscription revenue generated from quarterly or annual contacts is referred to as CMMR.
Longer contracts have higher lifetime value (LTV) thus making them more valuable customers. CMMR is a common metric used by SMM and B2C companies because they have different types of subscription models such as monthly, quarterly, and annual contracts. Whereas for enterprise SaaS companies, annual contracts are the standard.
CMMR and MRR are generally reported together, in some cases, the CMMR is reported as a percentage of total MRR, and the difference between CMMR and MMR gives you insights into the stability of your user base.
For example, a SaaS product with 80% CMRR to total MRR has a very stable user base compared to a company with 20% CMMR to the total MMR. It is simply because fewer customers can churn in any given month that may hurt your revenue and finances.
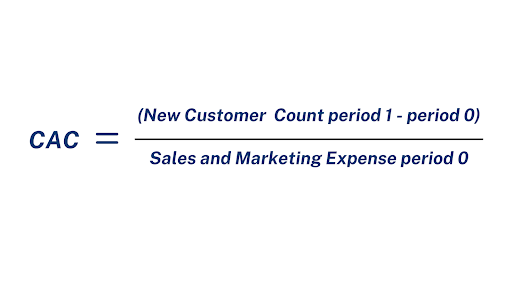
Customer Acquisition cost (CAC)
Customer Acquisition Cost (CAC) is the average cost to acquire a new user which is measured by calculating the expenses of the sales and marketing team in a given period of time and dividing it by the total number of customers acquired in the same period.
From advertising campaigns to any external agencies and freelancers, marketing software costs, to the annual salaries of marketing staffers.
This metric is easier to get a handle on after at least 12 months of data, and the more customers you win, the lower the acquisition costs get. It is a straightforward metric to measure, control, or scale. Generally, the more customers you acquire, the lower the customer acquisition cost.
LTV, also known as CLTV
LTV, also known as Lifetime Value, is the “monetary” value of a given customer. This is one of the SaaS metrics which is quite difficult to calculate because it requires at least one year of data to estimate LTV. Whereas calculating LTV from insufficient data might give you inaccurate values.
Once you have enough data (let’s say for 1 year) to estimate how much a customer is worth and how long your average customer uses your SaaS service, you can calculate the lifetime value (LTV) of your customer.
For example, if a customer is worth $1000 a year, and the average lifetime usage is 4 years, then the customer is worth $4000 – that is the LTV of the customer.
LTV to CAC Ratio
The Customer Lifetime Value (LTV) to Customer Acquisition Cost (CAC) ratio, often called the “LTV/CAC ratio” is a SaaS metric that is used to measure the sales efficiency of the company.
The relationship between the average lifetime value (LTV) and the average cost of acquisition (CAC) signifies how profitable a customer is for the business.
The LTV to CAC metric is calculated by dividing the LTV by CAC, where the ideal ratio should be above 1.
On the one hand, LTV/CAC ratio that is greater than 1.0 means that your SaaS company is generating value. On the other hand, if the ratio is below 1.0, your company is destroying value by losing money on every customer acquisition.
The LTV/CAC ratio of top-performing SaaS companies is somewhere between 3.0x to 5.0x.
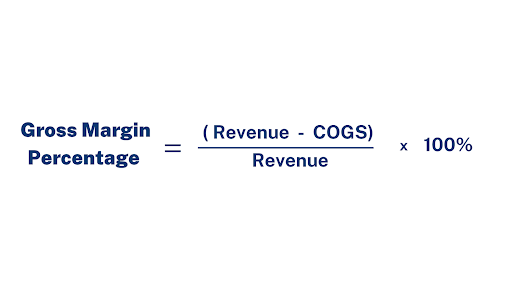
Gross Margin
SaaS Gross Margin is the difference between total revenue and cost of goods sold (COGS)
SaaS Gross Margin is a bit different than the “profit margin” that is more commonly used because profit margin simply compares the total revenue with the total expenses.
Whereas the gross margin only considers the “variable expenses” that accrued from selling one additional unit of goods or services. All the “fixed costs” such as rent, salaries, mortgage, etc are excluded while calculating the gross margin.
Gross margin allows you to understand how much revenue you would generate if you will produce and sell one additional unit of a product and how much money you would be spending in the process.
Gross margin is calculated in two different ways – Unit gross margin helps you to measure how much revenue you would generate from the sale of one additional unit of goods (in terms of money), whereas the margin percentage measures the gross margin as a ratio.
It is really important for SaaS companies to pay close attention to the gross margins because most companies follow a subscription-based business model that has a different life cycle and profit structure compared to the more traditional businesses.
For example, in the SaaS industry, the cost of launching a product from an idea to the end-user is heavily concentrated, especially during the stage of research and development. Therefore just looking at the net profit margin might not give you accurate insights on the company’s actual earnings.
The digital, pseudo-physical nature of the SaaS products (or subscriptions) also develops a situation where it is much better to separate the fixed cost from the cost that occurred during the actual selling of the product (Cost of Goods Sold).
Moreover, most SaaS companies begin their operations with deep losses (mostly due to the research and development stage) with the aim to overcome these losses in the future. This is where business leaders have to decide if they keep expanding and selling more products or make the business model more sustainable.
This is a question that cannot be easily answered by looking at the net profit margins, especially during the early stages of your SaaS business. Whereas the SaaS gross margin can help you analyze the company’s sustainability potential. If the gross profit margins are low or negative, your SaaS business may face financial difficulty.
The more gap there is between the marginal revenue and marginal COGS (Cost of Goods Sold) the better your business is positioned in the market.
Additionally, the gross margin is one of the most important metrics that banks, investors, and venture capitalists look at when it comes to making funding or investment-related decisions.
Strengthening this component in your company’s financial statements can help your company stand out from its competitors and possible alternatives.
Activation rate
The activation rate is the rate at which new users adopt your product or service. You can calculate the activation rate for your business by dividing the number of users who make it to your goal event by the total number of users.
To improve the activation rate for your company, your website, processes, sample products, and marketing materials must emphasize your business’killer idea.
Since the goal of businesses differs, so do the methods of determining and improving activation rate. Generally, you want to find out the actions that translate to successful customer acquisition and retention.
Churn – Gross Churn Rate
Gross Churn Rate is the percentage of Annual Recurring Revenue lost from contracts that are not renewed (customers lost due to canceled subscriptions).
Churn is another way of saying when a customer leaves. Ideally, growth rates should keep churn to a minimum.
If you’re losing 5% of customers and revenue annually to churn, providing you are growing at a rate of say 15%, the loss of that 5% still gives you a healthy 10% annual growth rate.
For enterprise SaaS companies, it is better to express this metric in dollars (monetary unit) and NOT by customer count because the impact of revenue is directly related to absolute dollar churn. Hence, this metric is often referred to as Gross Dollar Churn Rate.
Small and medium-sized companies as well as the B2C companies express this metric in terms of customer counts, thus it is simply referred to as Gross Churn Rate.
Churn rate could refer to customer churn or revenue churn. While customer churn indicates the number of customers your business loses as a percentage of your total users, the latter points to the amount of money you spend as a percentage of your total revenue.
Between the two types of churn rates, revenue churn is a better measure of successful marketing efforts, while customer churn is a better measure of your business health.
Both types of churn rates are directly proportional to each other. An increase in one leads to an increase in the other, and vice versa.
Gross Dollar Retention and Net Dollar Retention
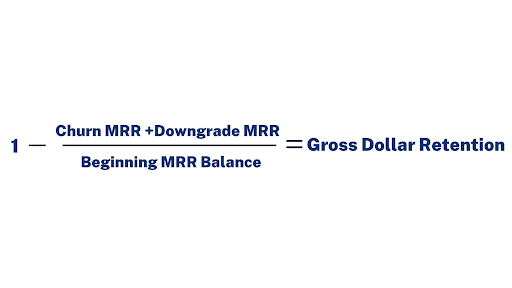
Gross Dollar Retention (GDR) is the lost revenue (in dollars) from your existing customer base. Lost dollars or loss in revenue happens due to churn or downgrades. “Churn” means when a customer is completely lost due to contract cancellations.
Whereas “downgrades” are the net loss when a customer reduces the subscriptions, for instance, the number of users, limits, usage tiers, product features, etc.
The formula to calculate Gross Dollar Retention (GDR):
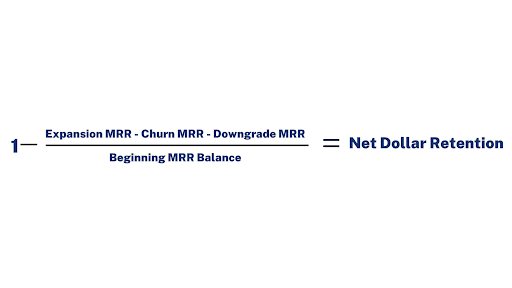
Net Dollar Retention or Net Revenue Retention slightly expands on the GDR (Gross Dollar Retention). While calculating the Net Dollar Retention, in addition to the churn and downgrades, we also expand to MRR or ARR (in the numerator of the above formula).
The “expansion MRR” includes the revenue increase (net dollar increase) due to up-selling or cross-selling of an existing customer.
For example, Customer A pays $12,000 for an annual subscription, and you cross-sell another product/feature for $5000 per year and the total subscription is worth $17,000 for a year. Therefore, we also include the $5000 expansion in the Net Dollar Retention (NDR) formula.
Remember, these metrics are only focused on measuring the performance of the existing user base, hence it does not include any revenue generated from new customers in a given month.
To calculate Net Dollar Retention (NDR), first, we calculate churn and downgrade MRR (similar to the step when calculating GDR), but now we subtract the “churn and downgrade” loss by expansion revenue (or expansion dollars).
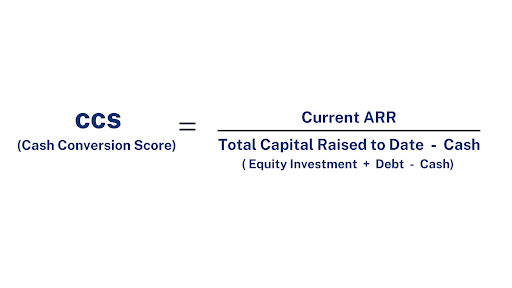
Cash Conversion Score (CCS)
Cash Conversion Score (CCS) is the company’s current ARR divided by the total equity and debt capital raised to date net of current cash (“Net of Current Cash” is the equity and debt minus the cash on the balance sheet).
Like other SaaS metrics that matter, the Cash Conversion Score shouldn’t be looked at alone. SaaS companies should be cautious enough to take too much investment before they have a clear product capable of satisfying the market (their product-market fit), and a scalable go-to-market strategy that can utilize the capital and turn it into results.
To track whether your “product-market fit” and “go-to-market strategy” is ready to scale, many other key metrics are important to track, most importantly your sales and marketing efficiency and your Customer Acquisition Cost (CAC) ratio.
It is vital to know the motivations behind the Cash Conversion Score analysis. This analysis is quite valuable for investors who want to calculate the ROI. For SaaS companies, it is important to understand how the investors are going to evaluate their business and decide if your company is prepared to take large funding and turn it into results (high ROI).
For SaaS companies with a Cash Conversion Score of 1.0, the primary focus should be on the product-market fit (developing a product that is capable of satisfying the market) and a robust go-to-market strategy (sales and marketing structures to position your product in the market, engage with the right audience and drive sales).
These 2 elements must work together efficiently to improve your ARR.
3) SaaS Marketing and Sales Metrics
Alignment of SaaS marketing and sales teams’ efforts is a very deep problem most SaaS businesses have in their growth journey.
There are numerous challenges to it: lack of processes for early-stage startups, chaotic processes for the rapid growth phase, lack of transparency between the departments, multiple levels of subordination and management at the maturity stage, and more.
The starting point to address these challenges is to understand which metrics you can use to align both teams around the main goal – your business growth.
Luckily, these metrics are pretty common for SaaS businesses as most SaaS companies have CRM in place and therefore can use it to extract the necessary data and insights. Let’s take a look at the metrics that both sales and marketing teams can use to facilitate growth.
Sales Accepted Leads
In simple terms, a Sales Accepted Lead is basically the borderline between your marketing effort and sales effort. This is where salespeople are saying: “Hey, marketing, thank you! I really want to talk to that prospect and I’m feeling good about it!”
Sales cycles of SaaS companies can be extremely long and it can take a lot of time for a lead to become a Sales Qualified Lead. Sometimes, before that happens, marketing teams don’t get any feedback from the sales team with regard to lead quality.
Sales Accepted Lead much predates Sales Qualified Lead and this is the key difference between the two – SAL is the first and the strongest signal that your marketing team can get that verifies their efforts.
This is why it can be used as a really powerful metric to provide valuable feedback much earlier, thus adjusting marketing strategies much earlier.
Not a Fit Leads
The second metric is a Not-a-Fit Lead, and as stated previously, you can have any name within your CRM system for this term, but, basically, a Not a Fit Lead is one that salespeople reject after talking to them.
It can be not-a-fit for various reasons – wrong budget, wrong product, wrong industry, wrong company size – the list goes on.
Of course, it’s natural for leads generated by the marketing team to get rejected by the sales team as they discover their prospects’ needs and possibilities. The most important thing here to track is the reason WHY they get rejected.
This is a really strong signal for marketing campaigns and budget optimization because when the marketing team is aware of the specific factor that prevented that lead from converting, fewer resources are then spent on future prospects of such a profile.
How do you usually define Not-a-Fits? And how do you establish the culture of building the feedback loop for Not-a-Fits?
What you need to do is that your marketing team needs to sit down with your salespeople and define specific triggers that make any lead Not-a-Fit.
From our experience, whenever we managed to align these triggers or reasons and reshape the structure within the CRMs a bit, that feedback loop was almost instant.
What it means in practice is that, for example, someone from sales says to marketing that a lead came and it’s Not a Fit, because we only provide POS solutions for specialty retailers while they’re looking for restaurants’ POS.
Then the marketing department instantly adjusts their paid ad campaigns to not show ads to users with restaurant queries, avoiding wasting ad budget on irrelevant leads.
Re-Engaged Leads
For SaaS companies, the sales cycle can be so long that you have your first touchpoint with the lead dating back to 2019, then you lose contact, and now, in 2026, they start talking to you again. These are referred to as Re-Engaged Leads.
What’s important to do with Re-Engaged Leads, is to learn how to attribute them coming back either to your sales team or your marketing team.
We’ve seen many times how both teams fight over the lead, each saying it was their efforts that brought the prospect back.
A Re-Engaged Lead is somebody who’s sitting there in your CRM for a while and it’s really important to see what exactly is building this re-engagement: a new marketing campaign or a sales email outreach? You need to know what actually brings people back on board.
Moreso, the more you know about it, the more effective your cooperation between sales and marketing will be. That’s why we need to establish a list of possible reasons why a lead can be re-engaged and attribute the reasons to the efforts of either team.
We saw it working in practice, it takes a little bit of time and effort between the two teams to build it, and we usually help facilitate that, because sometimes it’s not really straightforward for the teams to figure out how exactly to redefine Re-Engaged Leads.
However, the moment that happens and the moment you start monitoring these on a regular basis, you do increase collaboration between the two teams and you do increase alignment.
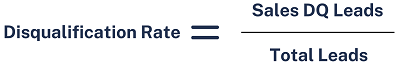
Disqualification rate
While many SaaS businesses are looking at the Cost per Lead and Cost per Acquisition, not all of them are looking into Disqualification Rate as the factor that determines where they are actually losing money.
We saw a lot of SaaS businesses fighting for lead quality and this is natural as everybody wants to get as many Sales Qualified Leads as they can. However, what usually was missing in the picture is the Cost per Disqualified Lead.
Disqualification Rate is the metric that will help you determine whether your marketing budget is being wasted away overtime on the leads that your sales team is repeatedly disqualifying.
Moreso, it is a very simple metric to comprehend as well. It’s a percentage that you can calculate straight away for a given period, you just need to know the total lead numbers and how many of them were disqualified.
We also saw Disqualification Rate being an effective KPI for marketing campaigns especially when you are spending money consistently on Paid Ads.
By decreasing your Disqualification Rate you are setting the right expectations for your marketing team (or an agency, or a person who is managing your ads) because all of you start looking in the same direction.
You want to bring your Disqualification Rate lower and lower as time passes, and it’s very easy to monitor. When you monitor your Disqualification Rate on a regular basis and take respective measures, you should see your lead quality increase.
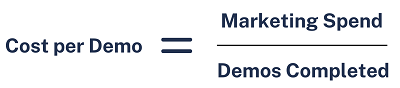
Cost per Demo
The second SaaS metric to track in order to help your SaaS company be more recession-ready is the Cost per Demo.
How do you calculate the Cost per Demo?
There are lots of ‘Сost per’ metrics associated with SaaS products. You can measure the Cost per Acquisition, Cost per Lead, but what we also saw effective as a metric to monitor on a regular basis is the Cost per Demo.
It’s also easy to calculate: you take your marketing spend for a period and divide it by the number of demos (sales pitches/calls) completed.
Why Cost per Demo? A Demo sits right in the middle of your sales funnel and you want to know exactly how much money it costs to bring somebody on the call with your salesperson.
Of course, you should still measure more top-of-the-funnel metrics such as Cost per Lead and more bottom-funnel metrics like Cost per Acquisition.
However, Cost per Demo is a great in-between metric to have in your SaaS business simply because it merges the effort between the marketing team and the sales team into one single metric that you monitor regularly.
Time to Contract
The third metric is the Time to Contract. The formula is simple: you compare the first touchpoint date, which could be the lead creation date in the CRM, and you get the conversion date.
This is the date when somebody actually signed up for your product and made a contract with you. The period between those dates would be your Time to Contract.
As mentioned before, SaaS companies tend to have very long sales cycles. And with the global economy experiencing somewhat of a recession, those cycles get even longer.
That’s why monitoring these timing metrics is extremely important – this knowledge can help you manage your sales cycles better during tough times.
It’s true that time-related metrics are a bit tricky to use and assess. However, they can bring a lot of insights into your cash flow and budget planning, as you can forecast much better knowing your sales cycle stages in detail.
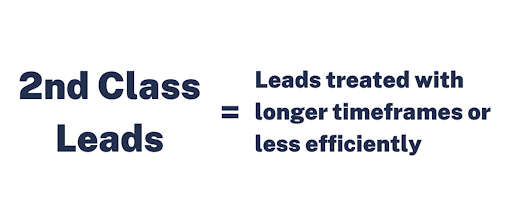
2nd Class Leads
Do you have 2nd class leads problem in your SaaS business? Let’s employ time-based metrics to find out.
The 2nd class leads problem usually happens when you have a specific group of leads (a cohort) that your sales team treats completely differently from other leads.
With the timestamp metrics, 2nd class leads are easily identified by looking at specific timestamps within your CRM data.
The first thing to look at is the difference between the time contact or prospect is created and a salesperson being assigned to them.
We often see that the sales team may consider marketing-generated leads as less important than leads from other channels (shows, outbound prospecting, etc.) and therefore they delay action on these leads.
As a result, the marketing team doesn’t have timely signals on real campaign performance and stays underinformed. This leads to inefficient marketing budget spending and increases tension between teams.
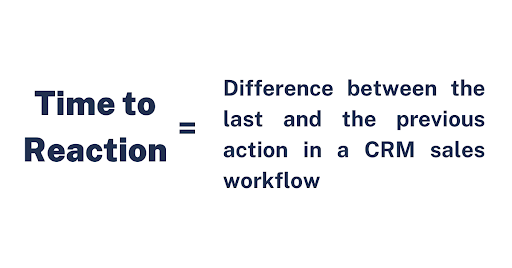
Time to Reaction
Another time-sensitive metric that can help you fine-tune sales and marketing teams’ interaction is Time to Reaction. This is the length of time between salespeople’s actions upon a lead.
This metric is very easy to identify and, usually, it gives a lot of insight into 2 main areas:
How leads from different sources are going through the sale cycle stages, and
How an individual salesperson’s performance is different when compared to the time needed to move a lead from one sales cycle stage to the next.
The perfect practical example of using the Time to Reaction metric will be to assess the speed with which you assign the salespeople to a lead.
It can be done automatically, it can be done manually, but you will have the timestamp between the time when the prospect was created in your system, till the time a salesperson was assigned to them, and then till the time when the salesperson actually reached out to them.
Fine-tuning SaaS CRM workflows and sales scripts based on this data can help you speed up the sales process and, again, give more timely signals to the marketing team on channels’ and campaigns’ performance.
Using time-sensitive metrics is a great way to group your leads into cohorts and analyze them by source, and by salesperson, looking at how exactly your sales team processes these leads and what causes you a slow down in your sales cycle.
Web traffic (volume)
This is measured through the number of Unique Website Visitors, and the average time they spend on key pages. Web traffic, generated through inbound marketing efforts (SEO, content marketing, social media) and advertising (PPC) is the best way to pull in potential sales leads.
Track this using marketing analyticstools of your choice, so you’ve got a clear idea of how much overall web traffic you’ve got coming in, and look for ways to increase it.
Pay Per Click (PPC) campaigns are usually run through Google Ads. You can set an overall budget and a budget for every keyword used. Within this, you’ll always have a clear idea of what your CPC is, which is part of your Customer Acquisition Cost (CAC).
Click-through rate (CTR)
CTR is the percentage of users who click and spend time on web pages, compared to those who saw your link and didn’t click through. Whether traffic is organic (e.g. content and social-driven) or via PPC campaigns, you need to constantlyimprove your CTR.
Click-through rate is one of the most crucial metrics for SaaS marketing, especially when measuring the various traffic streams to a website and the percentage of web visitors that click through from content, adverts, and email campaigns.
Aim to find the normal rates for your sector/vertical, and measure campaigns and inbound marketing efforts against those.
SaaS marketing metrics vs regular product-selling metrics
To understand the specifics of SaaS marketing metrics, you need to know the basic business logic of a SaaS company and how it’s different from other kinds of businesses.
SaaS isn’t about closing huge deals for six or seven figures or handling a massive array of products you’re selling. Here, we’re dealing with subscription-based service providing, so just measuring all the conversions of the leads you’ve generated isn’t all the marketing analysis you want to do.
Client retention rates are what matters arguably even more so than conversion rates – for a SaaS business to thrive, we’re looking for consistent long-term commitments. If we compare it to a product-selling business, we’ll quickly see that:
SaaS Marketing Strategy
Product Marketing Strategy
Service-selling focused approach
Product-selling focused approach
Based on high retention rates and upselling (i.e. premium plans)
Based on high conversion rates and encouraging big one-time purchases
Uses special offers by default as a way of making expensive plans more attractive
Uses selective sales and special offers to boost specific product purchases
As an online service provider, you most likely wouldn’t be looking at such marketing metrics as customer lifetime values. And one obvious reason is that it’s very difficult to calculate – even if someone buys from you on the regular, you wouldn’t be able to predict how much revenue in total they will bring over time.
That said, CLV is still tricky to calculate for SaaS businesses, but with only a few paid plans and predictable payment schedules, it’s easier.
The same can be said about such a SaaS marketing metric as customer churn. Since product-selling companies typically deal with one-off sales (barring loyal customers), customer churn isn’t one of the metrics that can be applied to them.
On the other hand, keeping customer churn as low as possible by building an effective marketing strategy is bread and butter for SaaS businesses. And to do that, they always need to be aware of the percentage of customers they lose within a certain period.
All SaaS-specific marketing metrics are based on the principles of longevity and predictability.
Monthly and annual recurring revenue (MRR, ARR), churn rate, and customer lifetime value have various degrees of importance for various types of businesses, but as far as SaaS is concerned, these are key.
Make Your Metrics Actionable
We’ll review your SaaS metrics and design a simple dashboard that guides growth decisions instead of vanity reporting.
Improving the metrics we have discussed would directly translate to higher profit margins and help you cut out NVA activities from your operations.
1. Identify Your Most Vital Metrics
Every startup and SaaS company will have its preferred metrics. Measurements for success, and ways of tracking this data. CMOS and CEOs need a clear 360 overview of this information.
When trying to work out your ARR, remember to take into account those paying every month, and annually. Also, take away those likely to stop subscribing, based on current churn rates. This should give you a fairly accurate ARR.
SaaS CMOs and CEOs could also run a projections spreadsheet, based on the potential value of new customers entering the pipeline, so you can start to project forward. However, don’t count this into actual revenue, until a client starts paying, and don’t ignore the SaaS CRM time-sensitive metrics.
The SaaS CEO and marketing teams need to take the next steps to drive forward growth.
2. Set Up Traffic And User Analytics Dashboard
Use website and mobile app analytics to get insights into your traffic quality. Analyze your traffic volume, time people spend on the website or in the app, and click-through rates.
However, this is only one part of the overall marketing picture, albeit one of the best ways to track key SaaS metrics.
Whenever possible, aim to bring all the metrics you need to track into a dashboard. To ensure that SaaS leaders can have a quick overview of where the numbers are going every month.
When it comes to measuring SaaS metrics before you even put a strategy in place, you need a clear idea of the following:
Is growth going up or down?
What do the numbers look like at the top, middle, and bottom of the funnel (e.g. when a customer decides to buy, or not)?
If you operate using a Freemium model: How many sign-ups vs. the percentage who stay as paying customers?
When it comes to marketing: which SaaS metrics are working and which aren’t?
Can we then double down on what is working?
Any dashboard needs to include all of the key SaaS metrics outlined in the section above.
Make sure you’ve got a clear handle on MRR, ARR, growth and churn rates, and of course, conversion rates.
If you’ve got salespeople playing a role in the sales/marketing funnel, then it helps to understand their conversion rates too.
3. Outline Your SaaS Marketing Strategy
Once everything is set up to monitor growth activities, you need to design and implement a marketing strategy. Base this on a few simple questions:
Who are our customers? Where are they? How do we reach them? What content or advertising would be useful to attract their attention? Once we’ve got their attention, how do we keep it? How do we convert them from being web visitors to paying customers?
Every SaaS marketing strategy is unique, of course. A one-size-fits-all approach doesn’t exist.
However, many include similar components and are running up against the same challenges: Getting the attention of your target audience and converting as many as possible.
As a former CMO of Slack says:
“Marketing is the fuel to the fire. Once you’ve got great product/market fit, marketing, and all the different tools that we have, everything from advertising to nurturing to conversion rate marketing to split testing to positioning messaging, those are all the tools that can help just accelerate that growth further.”
Normally, the first year or two in the lifecycle of any startup and software company is finding what works and what doesn’t. To measure everything as effectively as possible, you need analytics and a dashboard.
That way, you can see whether the content is generating leads, or how many are coming through advertising and if social media is increasing traffic.
4. Generate Traffic to Your Website
Once you’ve decided on a marketing strategy to implement, you need to know how to move forward. First, you must decide to whom to entrust your marketing operations.
Will you hire a marketing person, work with anexternal agency,freelancers, or a hybrid mix of the above?
The aim of any marketing strategy should be to get traffic to the website and app if you have one. Once you’ve got visitors visiting, the aim should be to convert as many as possible.
5. Monitor Your Marketing Performance and Increase Conversion rates
This is where you move from marketing into either sales or onboarding, depending on the pricing model you operate. When software sells for a higher monthly price and therefore requires custom pricing for every new client, you often need salespeople.
Whereas, the companies that operate on a lower-price freemium model often need a smooth onboarding process to generate the sort of conversion rates you need.
This is where analytics plays such an important role. When you know what the figures are looking like and what metrics to look at, you can start to identify ways to increase conversion rates.
Whether that means improving the user experience and onboarding, using AI-powered bots, FAQ sections, videos, instant demos, or other methods to generate more revenue.
The Importance of Tracking SaaS Marketing Metrics
Setting up a dashboard, or series of interconnected analytics systems is an essential part of monitoring SaaS marketing metrics. It’s a worthwhile investment, either right at the start of a growth journey or as soon as you can invest in this.
Once you know where you are with every measurable, you can improve and increase marketing activity, according to what’s working and what isn’t.
When marketing is working, revenue, profits and the long-term value of every customer should keep increasing, even in a recession, alongside organic referrals.
At Rampiq, we can help you get everything up and running on the analytics setup side and marketing metrics growth giving you the tools and expertise you need to measure and scale SaaS marketing metrics with confidence.
Whether you are on track to win your first 100 customers or hit $10 million MRR, we are here for your every step of the way.
Conclusion
Measurement of results in your revenue, business health, and marketing areas is the strong foundation for your SaaS business’ growth and success. This guide gave you the critical metrics you need to control in order to get a 360-degree view of your business.
These SaaS metrics should be interpreted in the context of your business and we highly recommend incorporating them into your daily, weekly, monthly, and yearly performance analysis.
You can create cohorts of metrics and analyze each cohort with a specific frequency, but it’s important to understand the business value behind each metric.
For more information on the topic of Advanced SaaS metrics please feel free to check out our Youtube video series and subscribe to our YouTube channel.
About the author
Liudmila Kiseleva
Liudmila is one of the best-in-class digital marketers and a data-driven, very hands-on agency owner. With top-level education and experience, Liudmila is a true expert when it comes to digital marketing strategies and execution.
A clear recap of the Google I/O 2026 search announcements, the intelligent search box, AI Mode by default, search agents, generative UI, and what the shift means for B2B brands.
Google sends far more traffic, but ChatGPT sends higher-intent B2B visitors and shapes deals your analytics never attributes to it. What the data shows and what to measure instead.
Google calls GEO and AEO 'just SEO,' then rebuilt Search around Gemini, AI Mode, and AI Overviews. Here's what the shift to AI search means for B2B visibility.
Revenue attribution models that connect content to pipeline, including the AI search blind spot most B2B teams don't know they have. Models compared, with practical fixes.
The AI marketing trends reshaping B2B in 2026, from AI search visibility and agentic workflows to buying-group personalization. With data, sources, and what to do about each one.