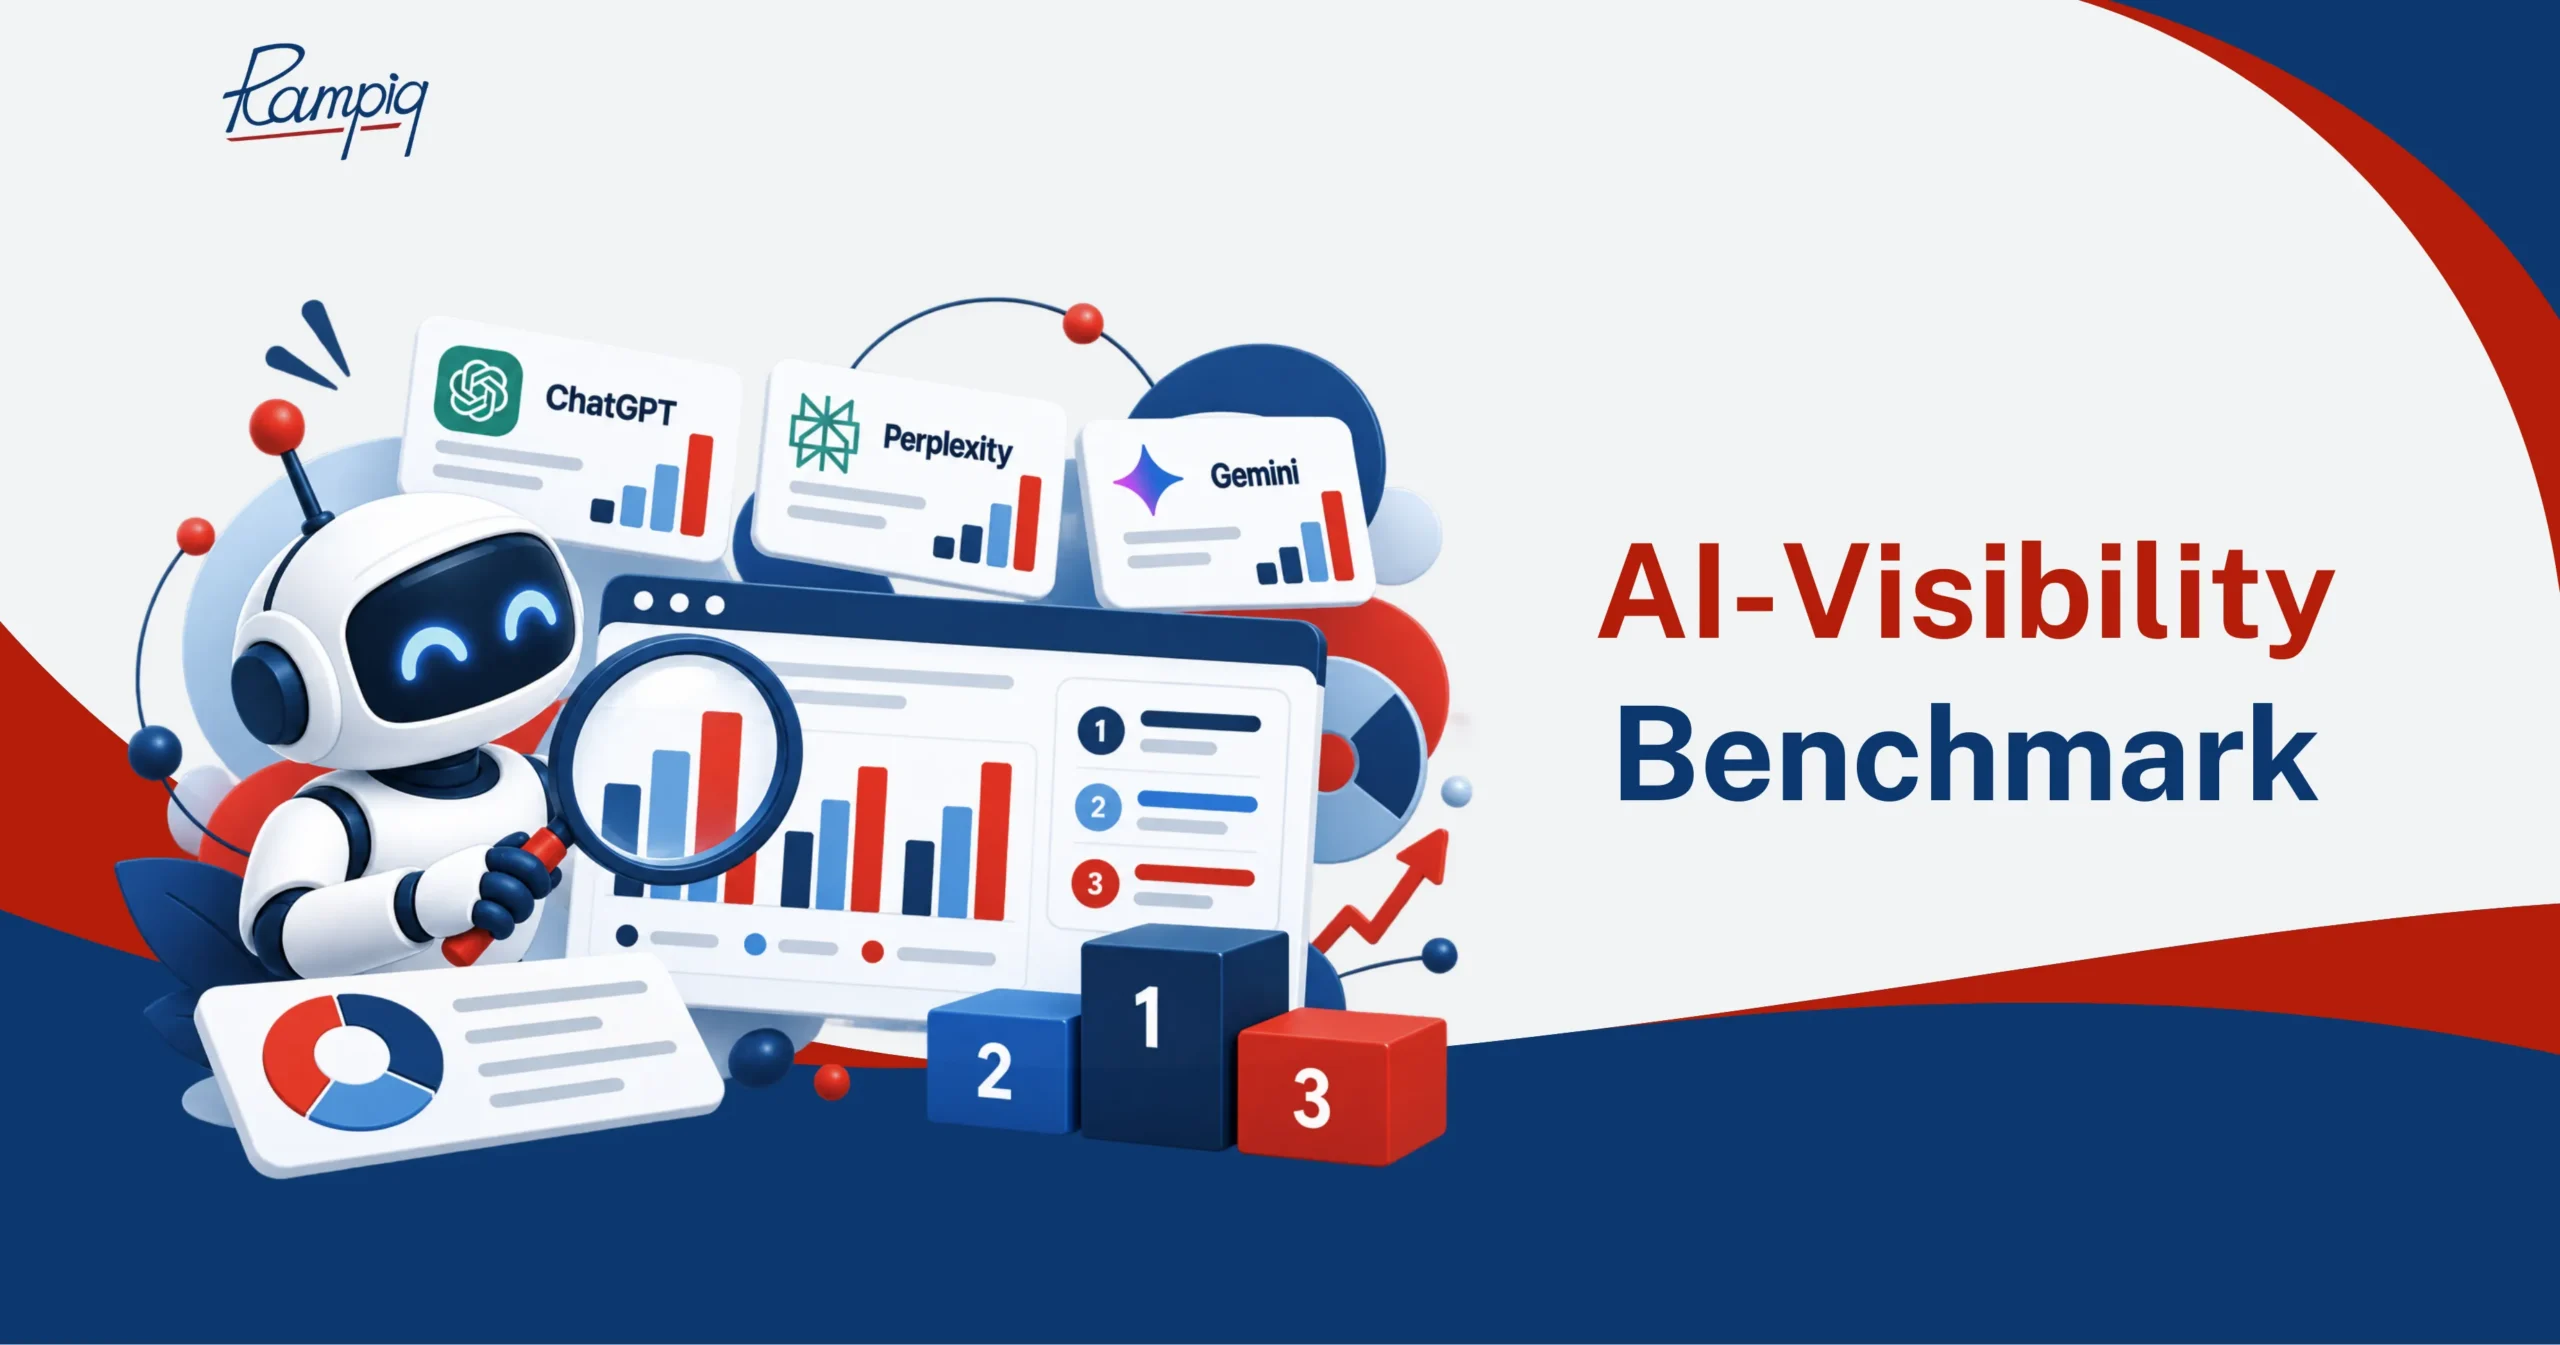
What does a normal AI visibility score look like for B2B SaaS?
An AI visibility score is a composite measure of how often and how prominently a brand appears in AI answers for a defined set of buyer prompts. Each study builds it differently. So “normal” only means something next to its scale.
| Study |
Sample |
Scale |
Average |
Spread |
| DerivateX (April 2026) |
50 companies, 1,400 prompts, 4 engines |
0 to 100 |
56.9 |
89 top, 2 bottom, 44% below 50 |
| DataDab (April 2026) |
50 companies, 1,500 queries, 3 engines |
0 to 10 |
5.60 to 6.23 by engine |
7.10 top, bottom-10 average 3.8 |
Read together, the two studies give a usable band:
- Below the line: a score under half the scale.
- Normal: the mid-50s to low-60s as a share of the scale, where both averages sit.
- Leading: roughly 70% of the scale and above. Each study’s top scorer sits in this band.
These bands are our reading of published distribution points. They aren’t computed percentiles: neither study releases the per-company data a true percentile cut needs.
How many B2B SaaS brands actually get cited?
In the 2026 samples, almost every B2B SaaS brand tested gets mentioned somewhere, and far fewer get mentioned often.
In the DerivateX sample, ChatGPT and Gemini mentioned 100% of tested brands, and Claude mentioned 88%. The gap opens on frequency and position, which carry 60 of the 100 points in that score.

The DataDab SaaS AI Citation Index shows the same split from the other end. Its top performer, Monday.com, scored 7.10 out of 10, while the bottom 10 companies averaged 3.8. No company in the 50-brand sample earned an A grade (data collected April 1, 2026).
Being named once ≠ being recommended.
How does citation share differ by sub-category?
Citation share is the percentage of AI answers in a category where a given brand is the cited or recommended source. It shows how concentrated visibility is.
ThriveStack’s 2026 benchmark (100 brands, 50,000 queries, 5 engines, 10 software categories) puts the concentration at 68.2%: that’s the share of all citations captured by the top five brands in each category.
The same study reports average citation probability by sector:
| Sub-category |
Average citation probability |
| DevTools and infrastructure |
71.4% |
| Security and compliance |
64.8% |
| Security and compliance |
64.8% |
| CRM and sales intelligence |
58.2% |
| HR and payroll software |
38.6% |
The 32.8-point gap between DevTools and HR software changes how you set targets. A score that’s below average in DevTools can be above average in HR tech. Benchmark against your own category, not a blended SaaS number.
How do ChatGPT, Perplexity and Gemini compare?
he engines disagree, so a single blended score hides where you’re actually losing.
| Engine |
DataDab average score (0 to 10) |
Share of LLM referral sessions (TripleDart) |
| ChatGPT |
6.23 |
72.2% |
| Gemini |
5.78 |
11.8% |
| Perplexity |
5.60 |
9.6% |
Brand-level gaps run wider than the averages. In the DataDab index, Intercom scored 7.16 in ChatGPT and 4.57 in Perplexity. That’s a 2.59-point spread on a 10-point scale.
Leading one engine doesn’t carry over. ThriveStack puts the probability of being top in Perplexity at 34.2% for a brand that ranks first in ChatGPT, and 28.7% for Gemini.
ChatGPT still drives most of the outcome. TripleDart tracked 65,583 LLM-sourced sessions across 28 B2B SaaS companies in Q1 2026, and ChatGPT produced 86.6% of the resulting AI-attributed leads (82 leads in total).
Which source types do LLMs cite for B2B queries?
A page-type citation pattern is how AI citations and AI referral traffic split across kinds of pages, such as homepages, blog posts and third-party review sites. For B2B SaaS, most AI citations point at pages a brand doesn’t own, and of the pages it does own, the homepage does the heavy lifting.
- ThriveStack attributes 84.1% of AI citations in its sample to third-party earned authority rather than brand-owned pages.
- EPR’s directional citation-share model (28 brands, 64 prompts, June 2026) gives G2 the highest weight among the sources it models, ahead of other review and analyst sites.
- In the TripleDart study of 11,513 cited URLs, homepages drew 31.9% of LLM sessions and 81.7% of the 82 leads.
- Generic blog posts drew 18.5% of sessions and zero leads in the same study, and listicles drew 7.4%.
Your blog may still be earning AI traffic. It just isn’t where the leads came from in that sample.
How the benchmarks were measured, and how to read your own score
Each study is a baseline snapshot from a single period. Their scores don’t transfer between each other. DerivateX weights mention rate and position. DataDab combines six weighted dimensions, from brand mention at 25% to competitive position at 10%, and ThriveStack measures citation probability on unbranded queries.
A query sample is the fixed set of prompts run across engines to produce a score. Check it first. About 28 prompts per brand in one study is a different instrument from 500 prompt templates per category, run 10 times each, in another.
Run-to-run volatility is the limit most readers miss. ThriveStack reports a 74% weekly citation turnover in ChatGPT answers. A score from one run can move without anything changing on your site.
How do you benchmark your own brand comparably?
- Fix a buyer-intent prompt set for your category and keep it unchanged between runs.
- Run it across ChatGPT, Perplexity and Gemini separately, and keep the per-engine scores.
- Repeat runs before you read a trend.
- Pair the score with AI referral traffic, so visibility ties back to pipeline.
That last step is how Rampiq runs it: a technical audit plus real-time dashboards tracking ChatGPT and Perplexity referral traffic via Vertology.ai.
For context on tooling, compare the AI visibility and GEO trackers that run these prompt sets. Once you know where you stand, fix the gaps the benchmark surfaces with a program built for B2B SaaS teams.
If you want your own number on the same footing, run your own AI visibility audit.