Revenue Attribution Models: What Each One Actually Tells You
Attribution models are frameworks for distributing credit across the touchpoints in a buyer’s journey. Each model answers a different question, and the one you choose determines which channels look like winners and which look expendable.
Single-touch models
- First-touch attribution: This gives 100% of the credit to the first interaction. If a buyer’s journey started with a blog post and ended with a sales call six months later, the blog post gets all the revenue credit. This model is useful for understanding which content creates demand. But it’s terrible for everything else. It ignores every touchpoint between discovery and conversion, which in B2B means ignoring most of the journey.
- Last-touch attribution: This credits whatever happened right before conversion. If the final touchpoint was a case study download, the case study gets 100% of the credit. This is the model most likely to get your content budget cut, because it systematically overvalues conversion-focused channels and gives zero credit to the awareness and consideration content that made the conversion possible.
Multi-touch models
- Linear attribution: This splits credit equally across every touchpoint. If there were four content interactions before a deal closed, each gets 25%. The limitation is it treats all touchpoints as equally influential, which is rarely true.
- Time-decay attribution: This gives more credit to touchpoints closer to conversion. It reflects how buyer decisions really work in most cases: recent interactions tend to have more influence than early ones. For B2B companies with sales cycles of 6 to 12 months, this is often the most realistic default model.
- U-shaped (position-based) attribution: This gives 40% to the first touch, 40% to the lead creation touch, and distributes the remaining 20% across everything in between. It works well when you need to understand both what creates awareness and what converts, without ignoring the middle entirely.
- W-shaped attribution: This adds the opportunity creation moment. It allocates 30% each to first touch, lead creation, and opportunity creation, with the remaining 10% spread across other interactions. For B2B SaaS companies with clearly defined pipeline stages, this is often the best fit because it maps directly to the stages sales teams care about.
- Data-driven (algorithmic) attribution: This uses machine learning to assign credit based on patterns in your actual conversion data. It adapts to your specific buyer behavior instead of following fixed rules. GA4 offers a version of this, though the most accurate data-driven models require 1,000+ monthly conversions to produce reliable results, which limits the model’s usefulness to higher-volume businesses.
Which model fits which question
| Question you need answered |
Best model |
Why |
| What content creates initial demand? |
First-touch |
Credits the discovery moment |
| What closes deals? |
Last-touch |
Credits the conversion moment |
| How do all channels contribute? |
Linear |
Equal credit, no assumptions |
| What matters most near conversion? |
Time-decay |
Weights recent touchpoints |
| What drives awareness and conversion? |
U-shaped |
Weights first and last, acknowledges middle |
| How does content contribute at each pipeline stage? |
W-shaped |
Maps to B2B funnel stages |
| What actually drives revenue in my specific data? |
Data-driven |
ML-based on your real patterns |
Why Every Revenue Attribution Model Above Misses AI Search
A growing share of the B2B buyer journey now happens inside AI tools that produce no trackable signals at all.

Forrester estimates that 70 to 80% of the B2B evaluation process happens in what the industry calls the “dark funnel,” the portion of the buyer journey invisible to your analytics. AI search has expanded that dark funnel significantly. When a buyer asks “what are the best platforms for [your category],” the entire interaction happens inside a closed environment. There may be no website visit, cookie, UTM parameter, or header.
Your attribution platform may log this as “direct traffic” or “organic branded search.” The actual moment of influence, the AI conversation where your brand was either recommended or excluded, is structurally invisible to every attribution model listed above.
93% of AI search sessions now end without a single website click, according to Conductor’s 2026 benchmarks. 94% of B2B buyers now use LLMs at some point in their purchasing process. And 74% of buyers confirm or suspect they have excluded a vendor simply because an AI tool failed to surface them.
Your content might be the reason you appear in those AI answers. , but your attribution model has no way to see it. This could imply that the next budget cycle may cut the very content that is driving deals.
At Rampiq, this is one of the most consistent patterns we encounter in B2B client work. Brands with strong AI search visibility see pipeline that their attribution models cannot explain. The content driving that visibility gets classified as a cost center because existing attribution infrastructure was never designed to capture AI-mediated influence.
How to Tie Content Metrics to Sales and Revenue (Including AI Search)
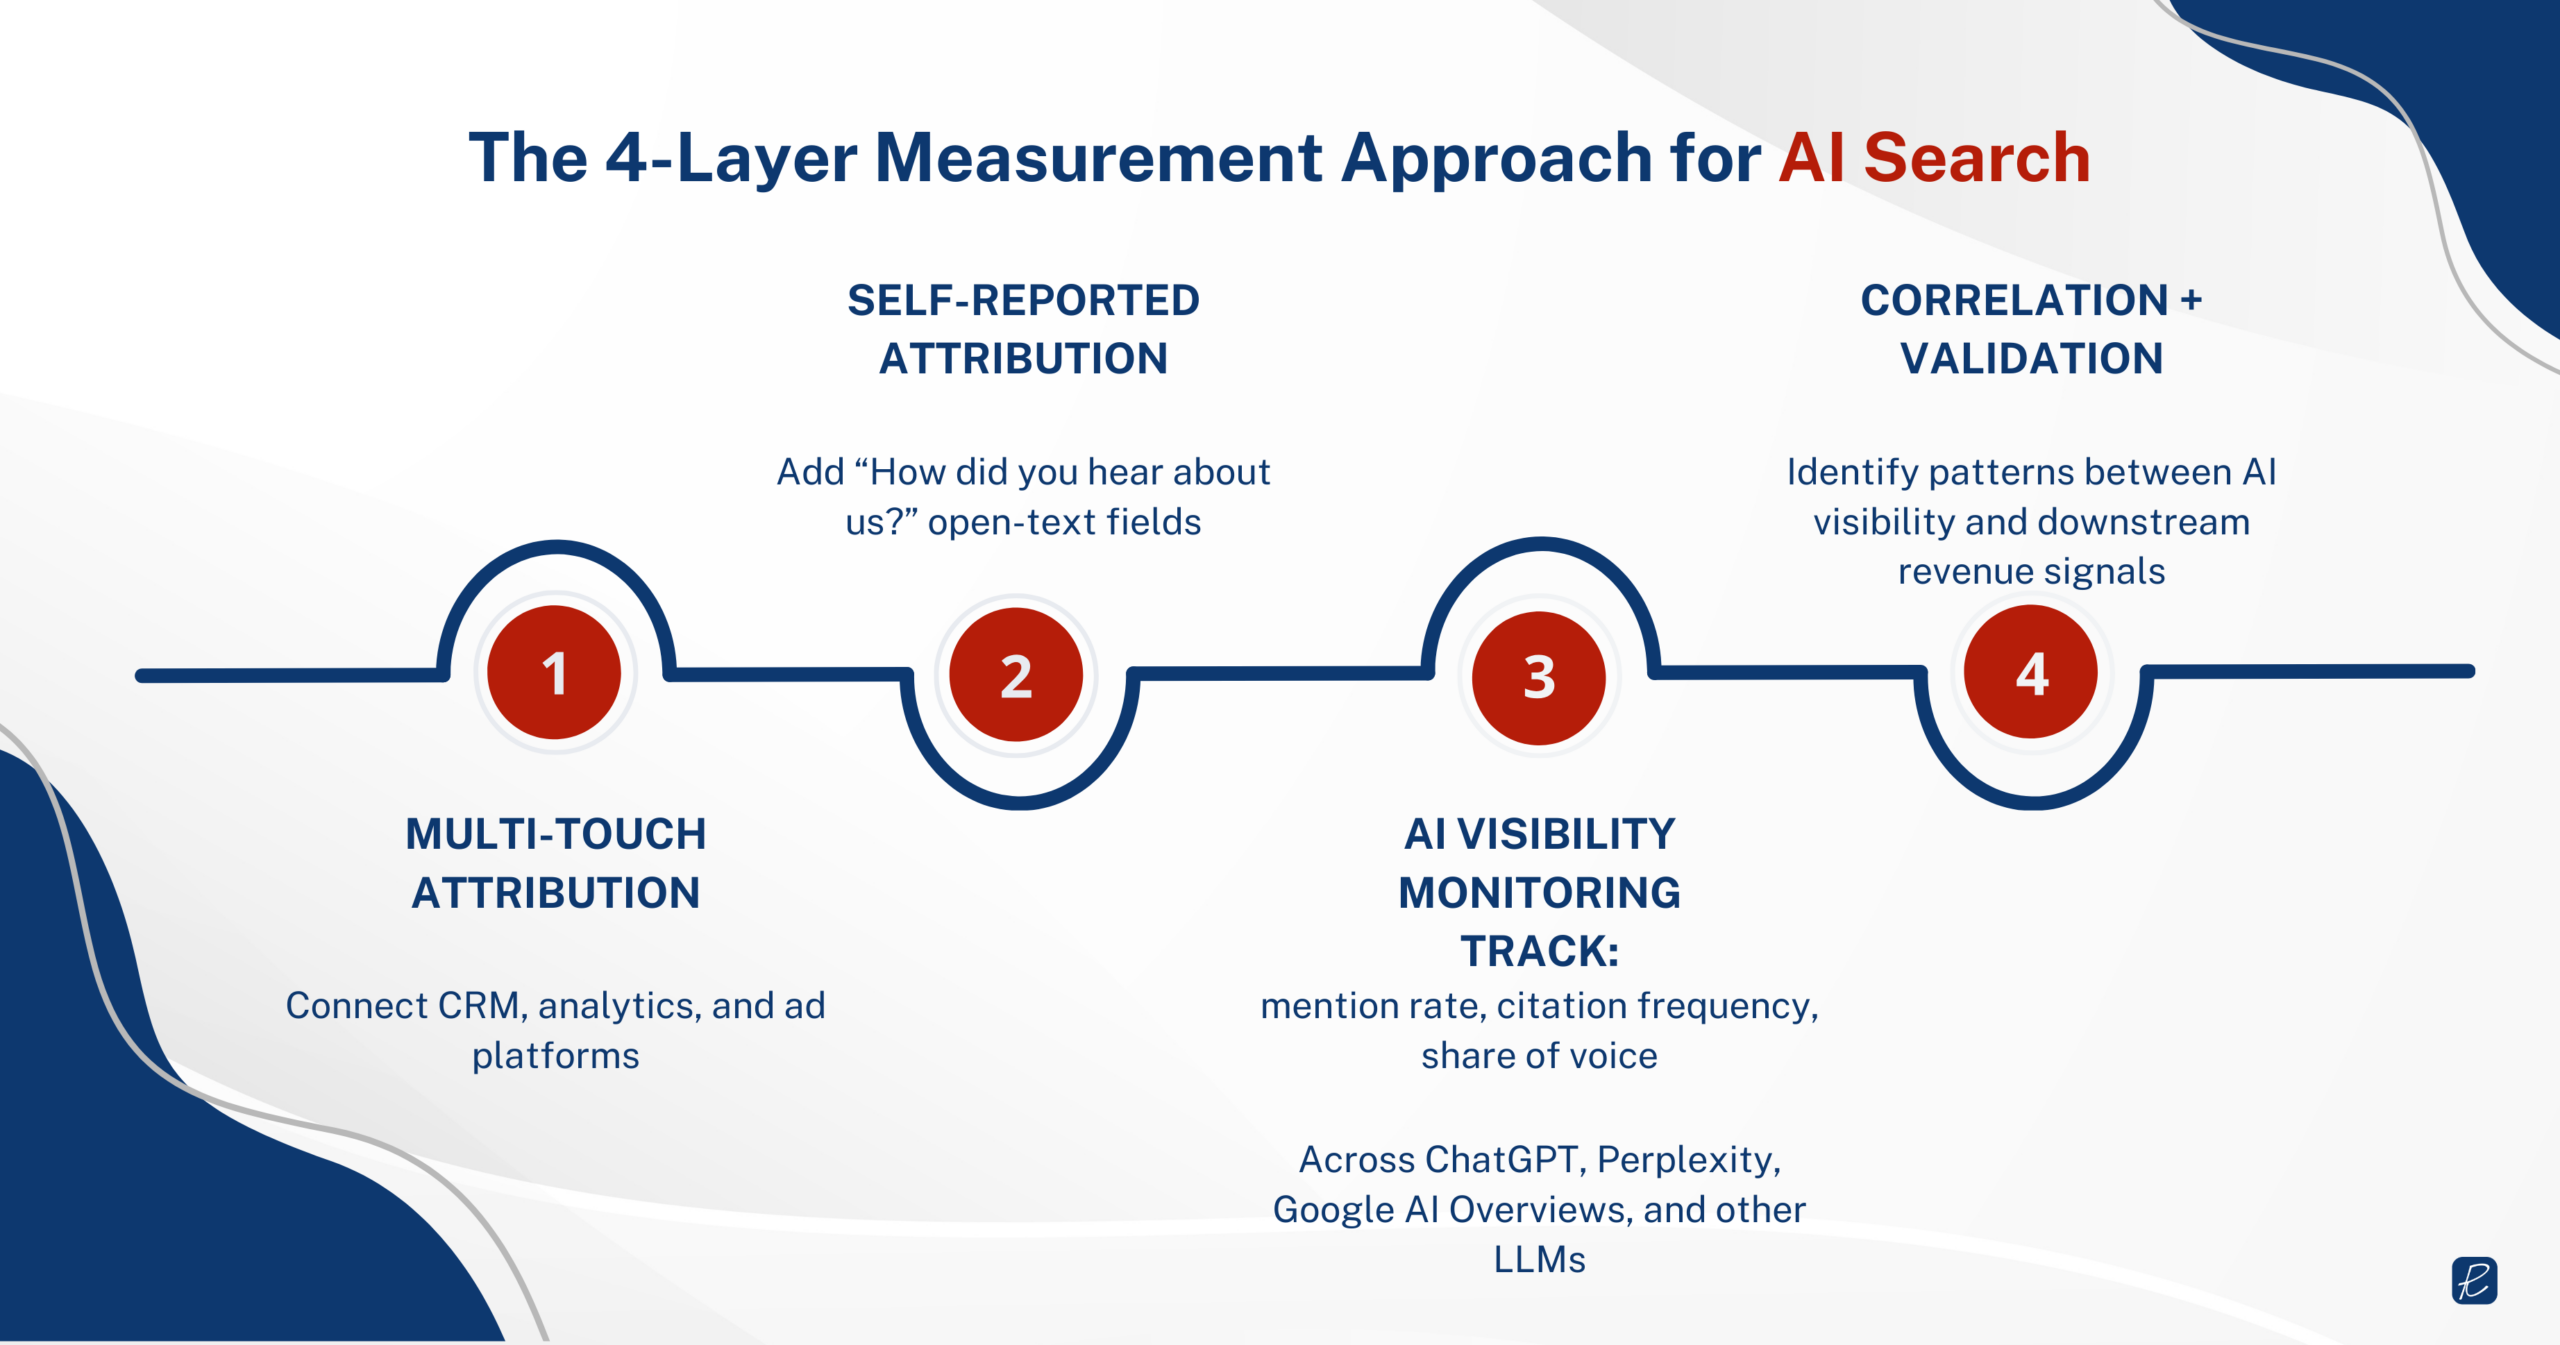
Layer 1: Multi-touch attribution for the trackable journey
Start with the basics. Connect your CRM to your web analytics and ad platforms so you can see the full content journey for buyers who do interact with your site. Use a multi-touch model that fits your sales cycle.
Configure GA4’s attribution lookback window to at least 90 days for B2B, since the average buyer journey spans 6 to 12 months but most identifiable content touchpoints cluster in the 60 to 90 days before conversion.
Layer 2: Self-reported attribution
Add “How did you first hear about us?” to your demo request form as an open-text field. Map responses tagged as AI-sourced to closed-won revenue in your CRM to calculate AI-influenced pipeline. Self-reported data has recall bias, but it captures signals that no tracking pixel ever will.
Layer 3: AI visibility monitoring
Track your brand’s presence in AI-generated answers. This means monitoring mention rate, citation frequency, and share of voice across ChatGPT, Perplexity, Google AI Overviews, and other LLM platforms, segmented by your core buying queries.
At Rampiq, we combine these AI visibility metrics with traditional pipeline data as part of our AI Visibility Program. We show clients not just whether their content ranks, but whether it gets cited, recommended, and trusted by the AI systems their buyers use.
Layer 4: Correlation and validation
Identify patterns that connect AI visibility to downstream revenue signals. Monitor branded vs. non-branded organic traffic ratios. A growing divergence between branded search growth and overall organic traffic growth can be a proxy for AI-influenced awareness, because buyers who discover you in an AI tool often arrive at your site through a branded Google search.
This is triangulation, not quite perfect attribution. But for the portion of the buyer journey that happens inside closed AI environments, triangulation is the most honest measurement available.