Google Analytics UA vs. GA4: What are the Key Differences?
Although some differences between the two platforms aren’t straightforward to categorize, for your convenience, we offer you following breakdown (in no particular order):
Comparing Main Metrics
Users
In Google Analytics 4, there are three user metrics: two have migrated from UA – Total Users, New Users, and one new primary user metric – Active Users.
Active Users are understood as users that have an “engaged session” on your website – a session that lasts longer than 10 seconds, or has a conversion event, or has at least 2 pageviews or screenviews.
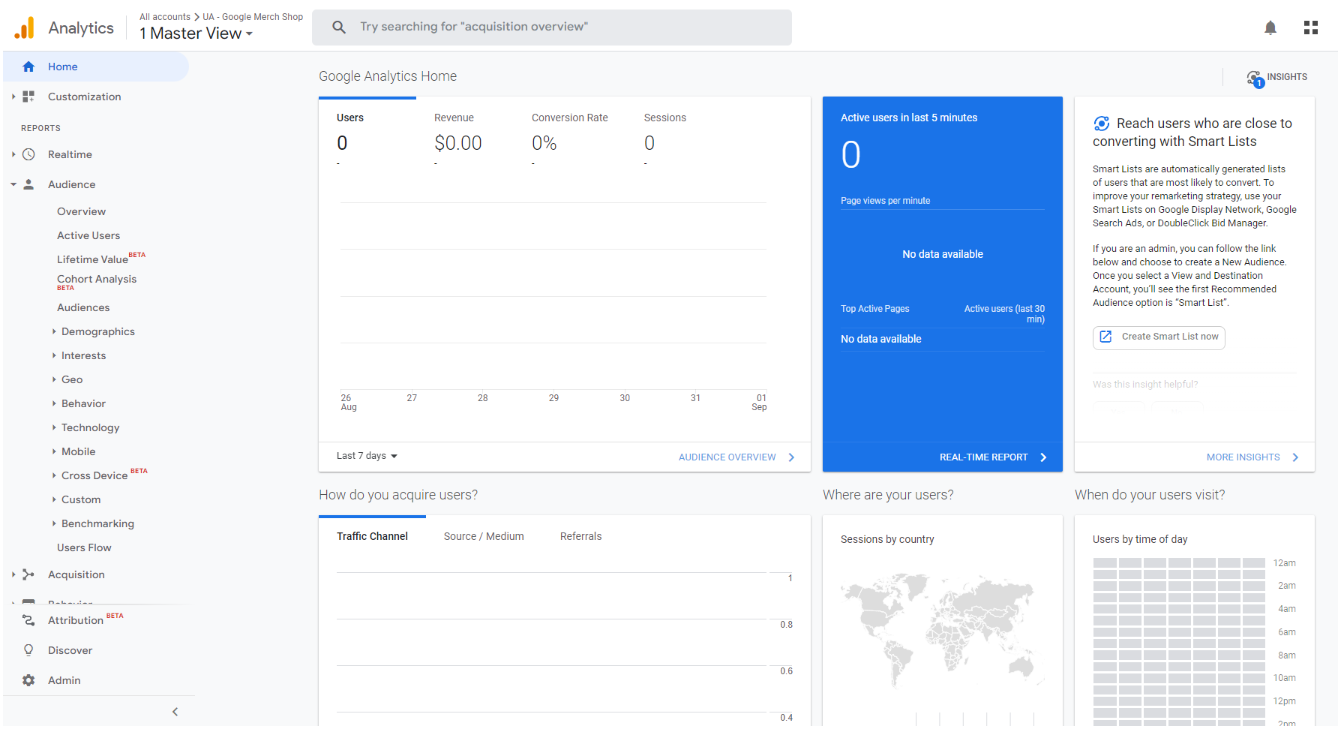
Universal Analytics highlights Total Users (shown as Users) in most reports, whereas GA4 focuses on Active Users (also shown as Users). So, while the term Users appears the same, the calculation for this metric is different between UA and GA4 since UA is counting Total Users and GA4 is counting Active Users.
Pageviews
Google Analytics 4 has this metric under a different name – Views, but the counting logic remains the same as in the Universal Analytics’ Pageview. It counts the total number of application screens and/or web pages viewed by your users. It’s also important to mention that the Unique Pageview metric has been removed and is not present in GA4.
Sessions
Session is a period of time during which a user is actively engaged with your website or app. The ways in which sessions are understood by the two platforms are the same:
- A session will end when there has been more than a 30-minute period of inactivity (depending on the session timeout settings).
- If a user comes back after a session timeout, it will start a new session.
However, there are a couple of technical differences:
- In UA, if the user is on the website at midnight, a new session will be started. In GA4 sessions are not restarted at midnight.
- In UA, if a user picks up new campaign parameters while on the website, a new session will be started. In GA4 sessions are not restarted when new campaign parameters are encountered.
Purchases
Web purchase counts between UA and GA4 will match.
Events
The Unique Event metric is no longer present in GA4. Total Events from UA have been renamed to Event Count in GA4. Moreover, GA4 events now have no notion of Category, Action, or Label – every “hit” is considered an event.
Bounce rate
In UA, Bounce Rate is a percentage of single-page sessions in which there was no interaction with the page. A bounced session in reports has a duration of 0 seconds.
In GA4, it is a percentage of sessions that were not engaged sessions. For example, if a user visits your website, reviews content on your homepage for less than 10 seconds, and then leaves without triggering any events or visiting any other pages or screens, then the session will count as a bounce.
Important – by default, all standard GA4 reports use the inverse of the bounce rate metric, the engagement rate metric.
Conversions
If your conversions are based on destination URLs or on UA events (i.e., Category/Action/Label) for which you have set up equivalent GA4 conversion events, Conversions should count the same – except for one technical detail.
UA counts only one conversion per session for each goal. So, if a user submits the form twice during the same session, only one conversion will be counted for the “Form Submit” goal.
On the other hand, GA4 counts every instance of the conversion event, even if the same conversion event is recorded multiple times during the same session. So, if a user submits the form twice during the same session, two conversions will be counted.
However, GA4 does have an option to switch to the original UA counting method.
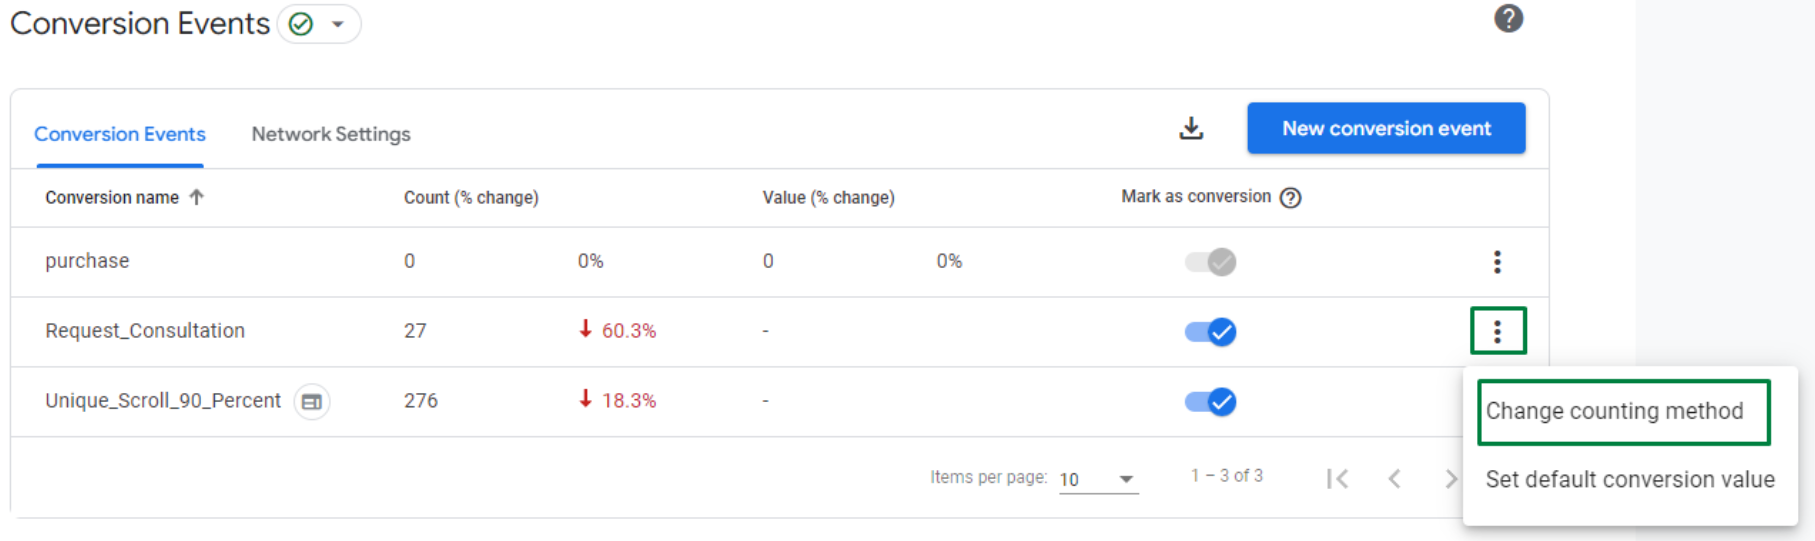
Once per event (Default)
Count an event as a conversion every time it occurs.
Once per session (Similar to UA)
Count an event as a conversion only once within a particular session.
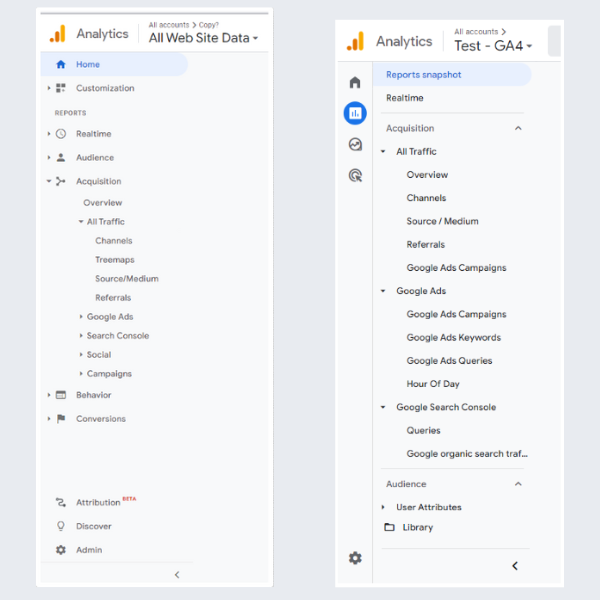
Reporting Interface
View and data streams
In GA4, the most noticeable change may be that there is no longer a third column on the main Admin panel – where the UA View panel used to be.
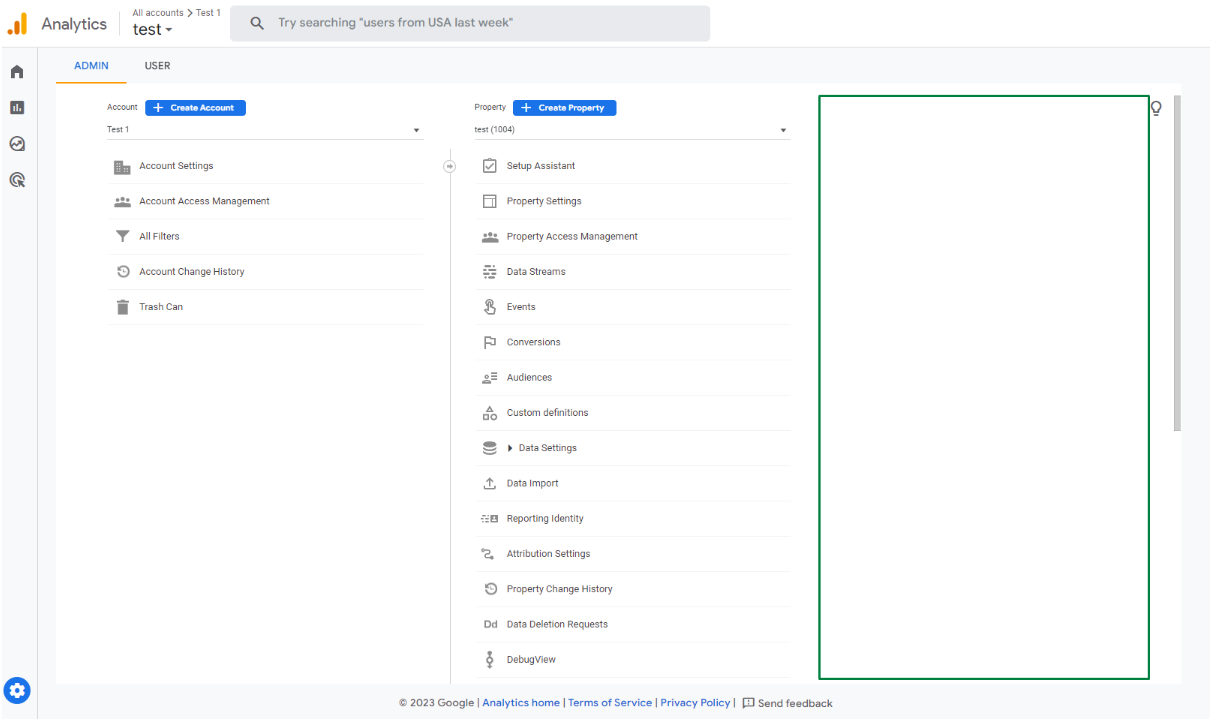
Instead, you analyze your Properties, including Data Streams that you can add for both your website and mobile apps to get overviews on both sources. Still, to some extent, the GA4 Data Streams are comparable in their nature to UA View.
Currently, you cannot simply create a copy of the data stream like you could for UA View, you will have to set up that data stream from scratch.
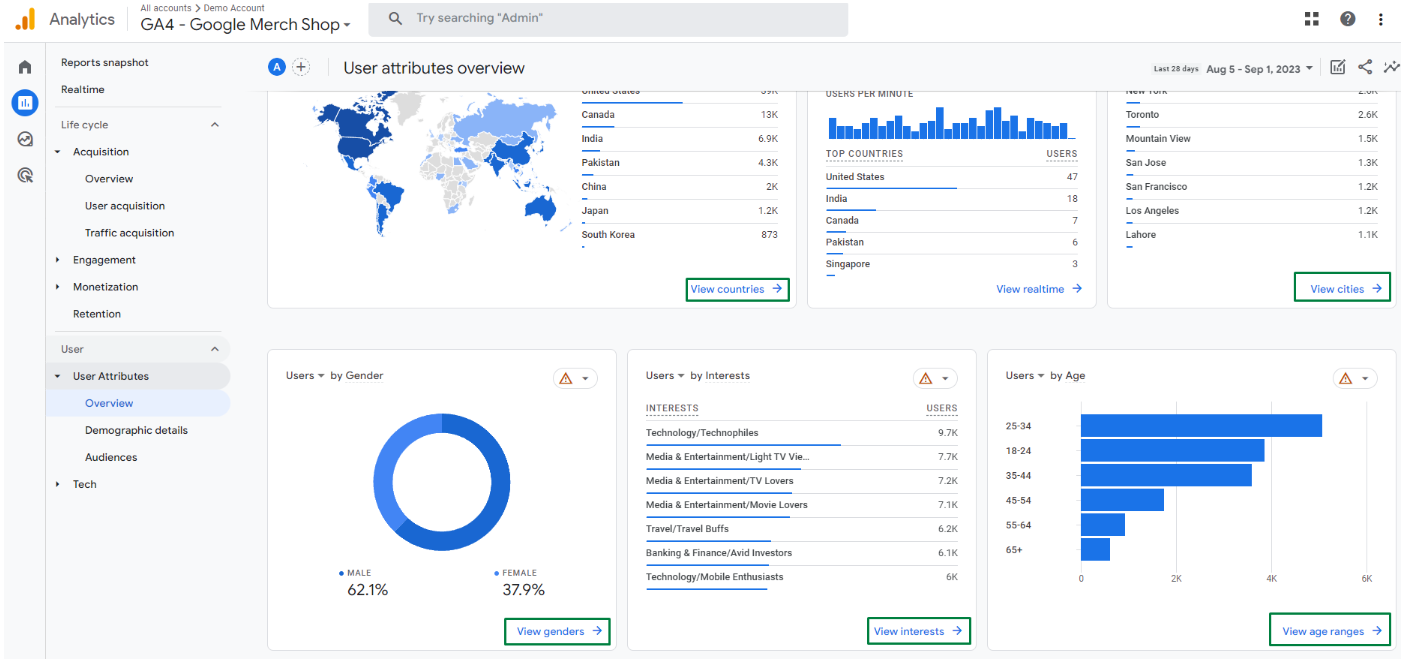
Standard reporting interface
Visually the GA4 report interface remains very similar to what UA had, only with a number of slight changes.
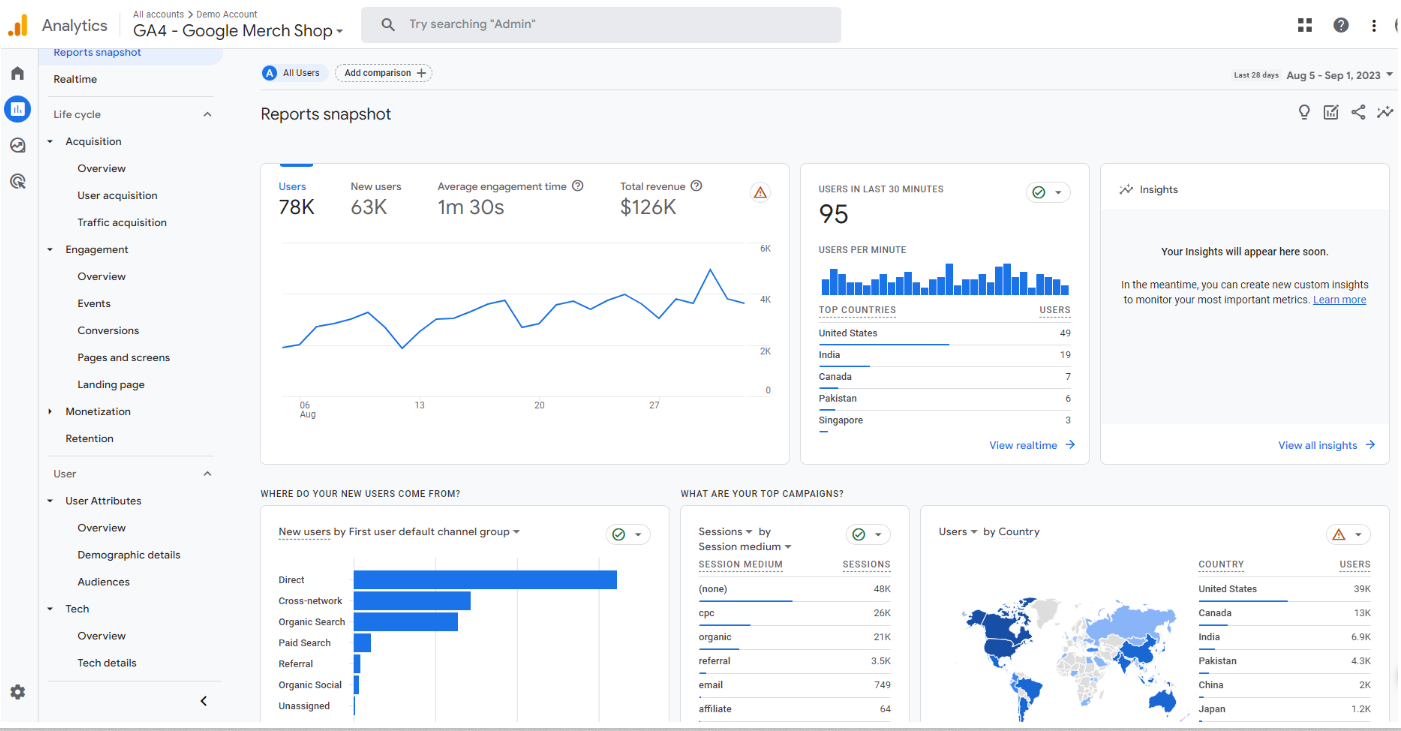
However, the default number of reports in GA4 has now become much smaller. That is because many reports have been grouped into small cards through which you can navigate to the full report.
Custom Reporting
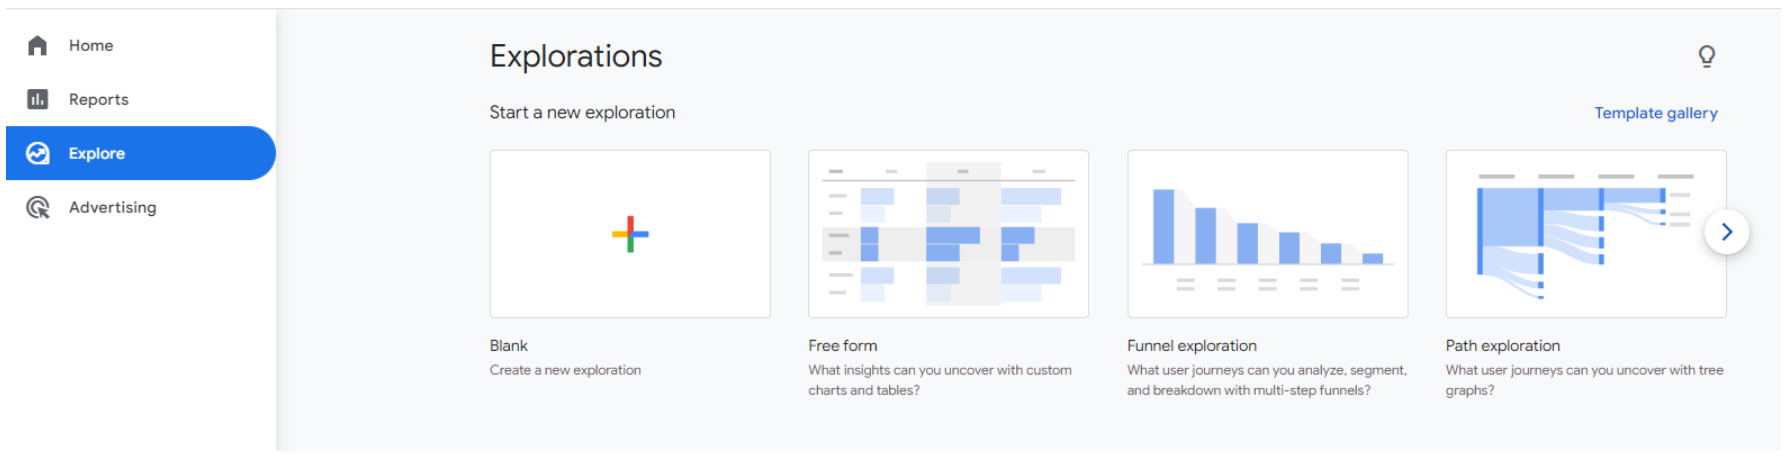
Explore section
A good quality of life upgrade – GA4 now has a separate Explore section, which also includes the types of visualizations such funnels that were previously available only in the paid version of GA360.
Library and collections
In GA4, the Library is where the existing reports are stored, which you also see in the standard sections. It is also a place where you create your own reports and customize them.
Another convenient solution is the grouping of reports and the creation of what Google calls Collections.
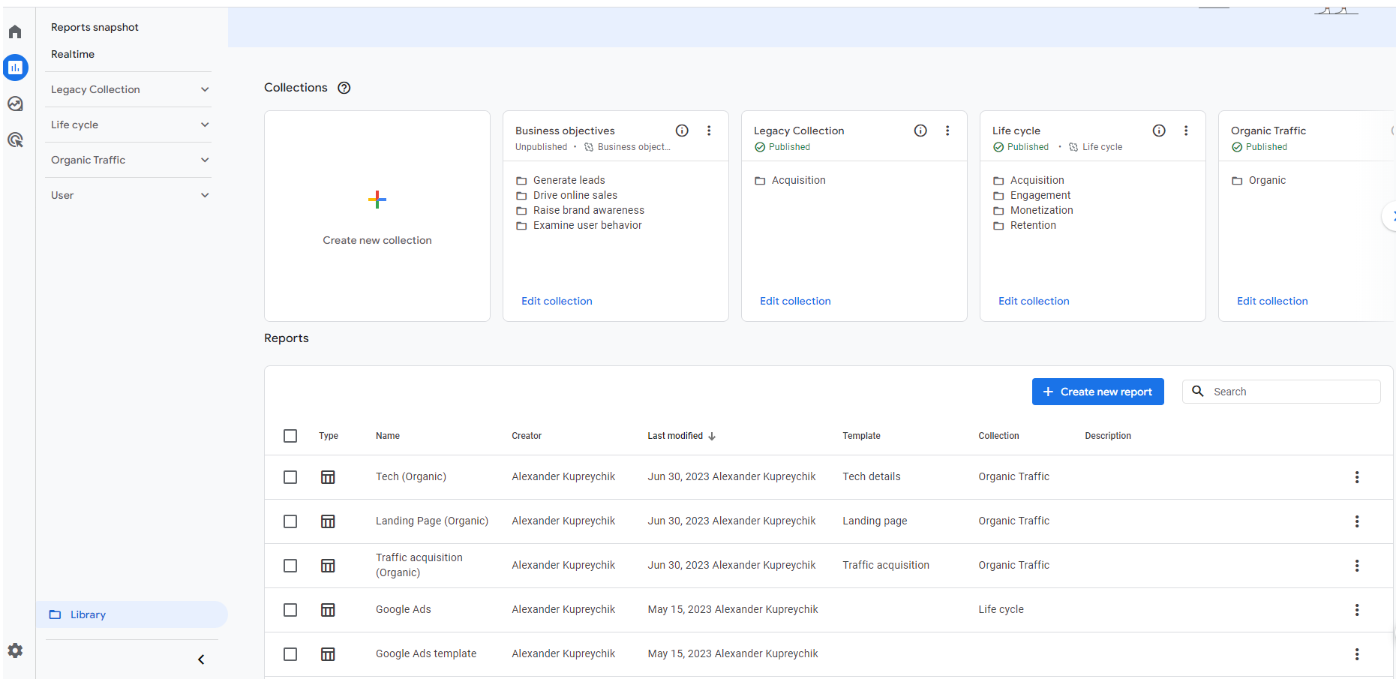
In this section, you can delete all standard reports and customize reports that are very similar to UA. So, if you are still struggling with GA4 reports, this is a great way to customize reports for each of your departments with the metrics you need.
Universal Analytics versus Google Analytics 4
Custom Dimensions & Metrics
Like UA, GA4 allows you to create custom dimensions and metrics.
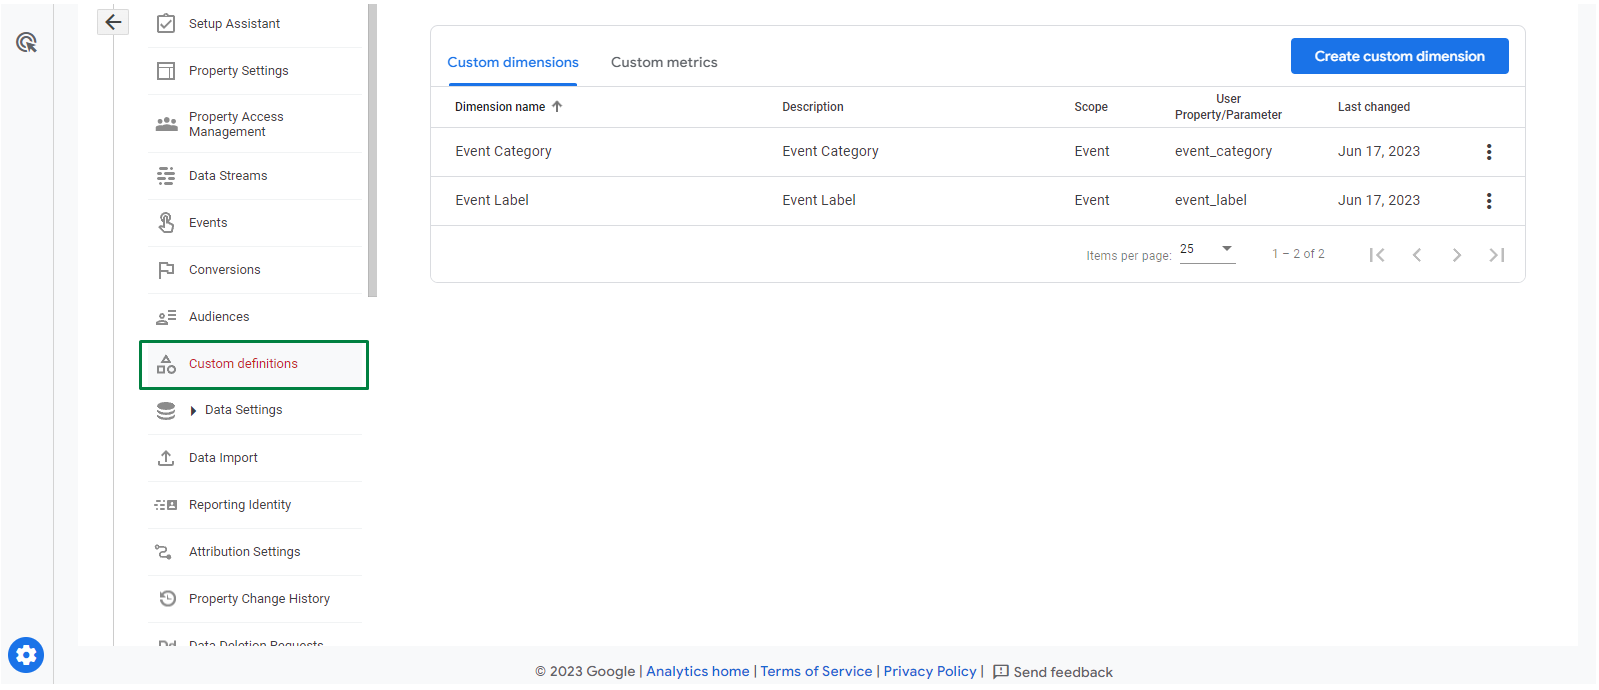
However, because GA4 uses a different, event-based attribution model, the Scope to which data the custom dimension or metric will be applied has also changed.
For custom dimensions, there are 3 available scopes:
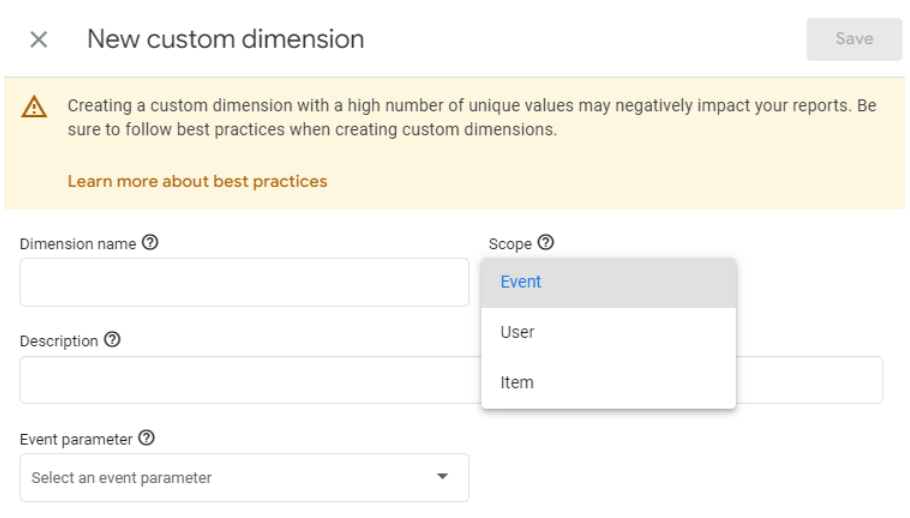
Event-scope is used to analyze an attribute about an event (such as the value of the event), Item-scope – about your product, and User-scope – about custom user ID, subscription type, etc.
With custom metrics, you can analyze the data points from an event parameter. For example, you can analyze the value of a transaction from an event parameter. Also remember that the only available scope for custom metrics is events.
Client ID & User ID
Similarly, to UA, GA4 offers 3 methods of user identification:
User ID
This method uses a customer-supplied ID to differentiate between users and unify events in reporting and exploration. If you create your own persistent IDs for signed-in users, you can also use these IDs to measure user journeys across devices.
Google signals
Google signals are understood as data from Google users who are signed and have consented to sharing their data. When Google signals data is available, GA4 associates event data it collects from users with their Google accounts.
Device ID (Client ID)
This method uses the client ID for websites or the app Instance ID.
It’s important to note that by default, GA4 uses the blended method, which uses the first available method, in this order: User ID > Google signals > Device ID
Also, in GA4, creating a separate data stream or property for User ID is no longer necessary – your GA4 property will automatically include User ID data.
BigQuery
One of the big benefits of GA4 is that you can now connect to BigQuery for free.
BigQuery is a serverless and cost-effective enterprise data warehouse that works across clouds and scales with your data. This can come in handy if you need unlimited amounts of data requests, non-sampled data, and other integrations with third-party tools.
Filters and Segments
Data Filters
A data filter lets you include or exclude incoming event data from being processed by Google Analytics. It’s important to note that analytics evaluates data filters only from the point of creation and onwards, and does not affect historical data.
Unfortunately, at the time of writing, GA4 does not have the same number of filter types as UA, with only the following being available:
Developer traffic: Filter out activity from developers who use debug mode.
Internal traffic: Filter out users with an IP address or range of IP addresses.
So you will not be able to exclude any country or domain from the data, at least at the property level.
Still, some of the filters can be customized in Google Tag Manager or GA4 standard reports or custom reports you can create. It’s also worth noting that over the last year GA4 saw many quality of life improvements, enhancing the capabilities and usability of the system. So there’s a good chance we could see new filters in GA4 at some point as well.
Segments
A segment is a subset of your Analytics data that can be used in Explorations. For example, of your entire set of users, one segment might be users from a particular country or city. Another segment might be users who purchase a particular line of products, or who visit a specific part of your site, or trigger certain events in your app.
Segments are similar to filters, with the only differences being that the former are more flexible and work with historical data. So you can create segments of users that started interacting with a form on your site + viewed important pages or subscribed to updates but never submitted the form.
Also, based on the segments, you can create audiences, analyze, compare and contrast them, and then use them in Google Ads.
Measurement
UA used a Session-Based data model, which was based on sessions and pageviews; in contrast, GA4 uses a flexible event-based data model.
Session-Based model
In UA properties, the system groups data into sessions which serve as the foundation of all reporting. During a session, Analytics collects and stores user interactions, such as pageviews, events, and e-commerce transactions, as hits. A single session can contain multiple hits, depending on how a user interacts with your website.
Event-based model
In GA4 properties, you can still see session data, but the system collects and stores user interactions with your website or app as events. Events provide insight into what’s happening in your website or app, such as pageviews, button clicks, user actions, or system events. Events also collect and send pieces of information that better specify the action the user took or add further context to the event or user.
One of the main benefits of this updated system is that we now have no limits on various assignments for Event Category, Event Action, Event Label. This means you can now assign any properties and event levels, and give them any custom names you see fit. For example, a button click event can contain such properties as: “Button_Text“, “Button_Location“, “Button_Type“, “Page_Category” or even “Button_Color“.
E-Commerce
Note that if you were previously using Ecommerce, your developer will need to update the entire Enhanced Ecommerce schema in order for it to work in GA4. Not to mention, the new measurement requires a new structure as well.
For guidance, we’ve written an article on this topic – so if you need help, visit 5 Challenges for GA4 E-Commerce Setup and How to Address Them.
After updating the data schema, you will get a report that is as close to UA as possible. It will have all the same data along with additional customization options.
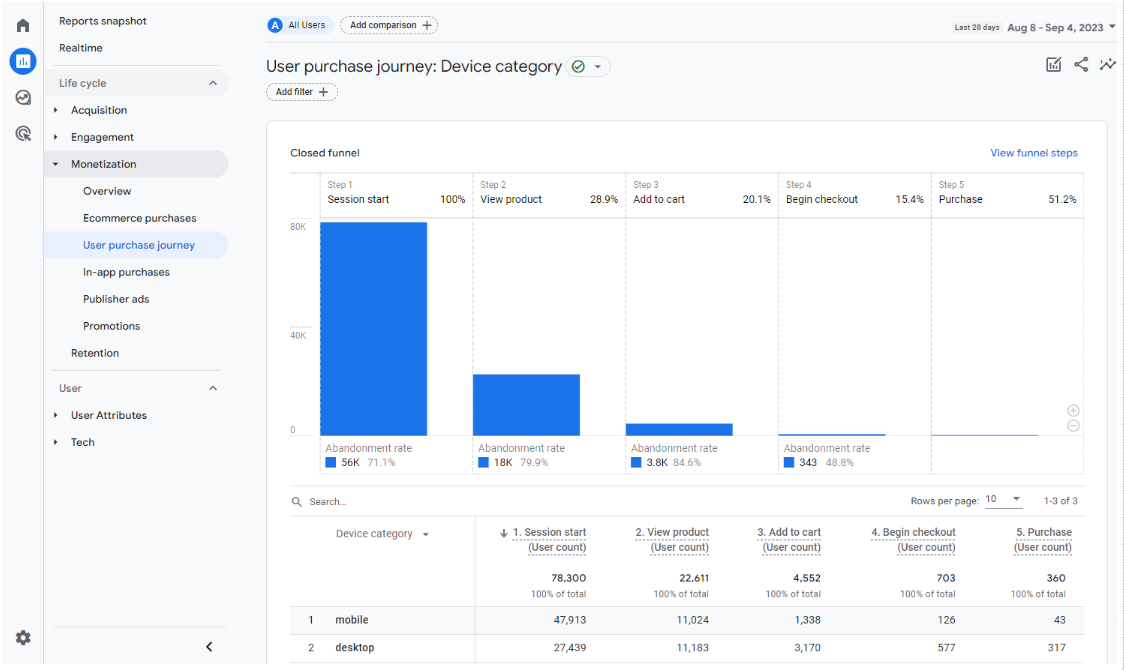
Also, when it was just introduced, GA4 lacked the Shopping Behavior funnel.
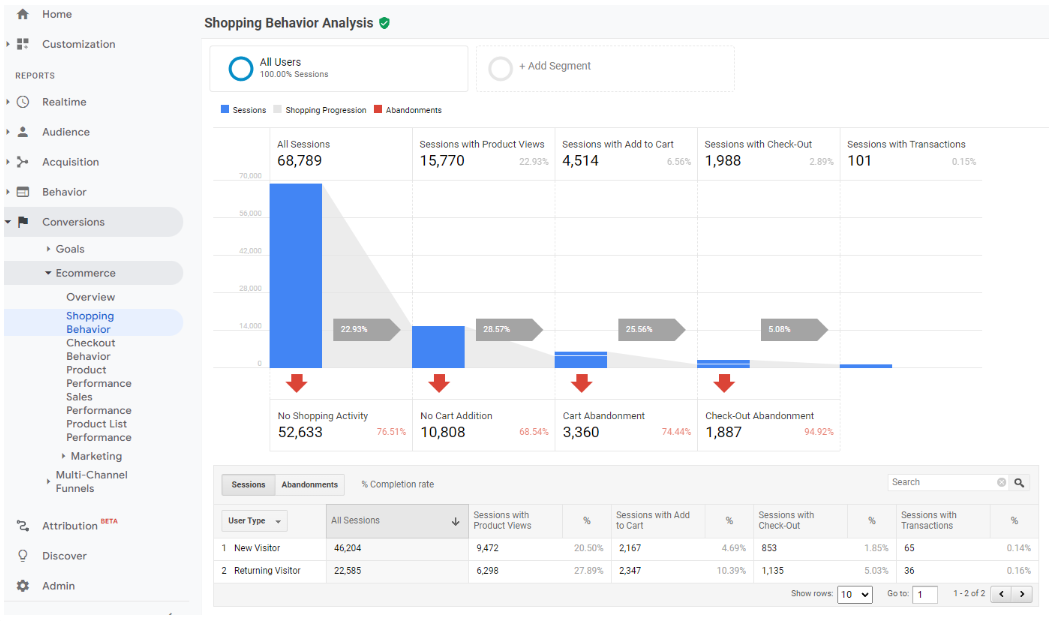
However, with the Aug 2023 update, this issue was fixed. The update introduced behavioral modeling in path and funnel reports:
“Behavioral modeling data is now available in any exploration or report that includes paths and funnels in Google Analytics 4. More specifically, this includes the path exploration and funnel exploration, as well as the user purchase journey report and custom funnel reports.”
Attribution Modeling
Universal Analytics reports used to attribute the entire credit for the conversion to the Last Non-Direct Click. The downside to that logic is that it ignores direct traffic and attributes 100% of the conversion value to the last channel that the customer clicked through from before buying or converting.
Examples:
- Display > Social > Paid Search > Organic Search → 100% to Organic Search
- Display > Social > Paid Search > Email → 100% to Email
- Display > Social > Paid Search > Direct → 100% to Paid Search
Other attribution models were only available in the Model Comparison Tool in the Multi-Channel Funnels (MCF) reports section.
You can find a similar section in GA4 in the Advertising section > Attribution collection, and it’s called Model Comparison and Conversion Paths reports.
More importantly, though, in GA4, sessions have been replaced by events as the foundations of data collection and reporting. On top of that, GA4 makes it possible to report attribution using a selected attribution model for any event (not only for conversions).
The data-driven attribution model is now the default model used by GA4.
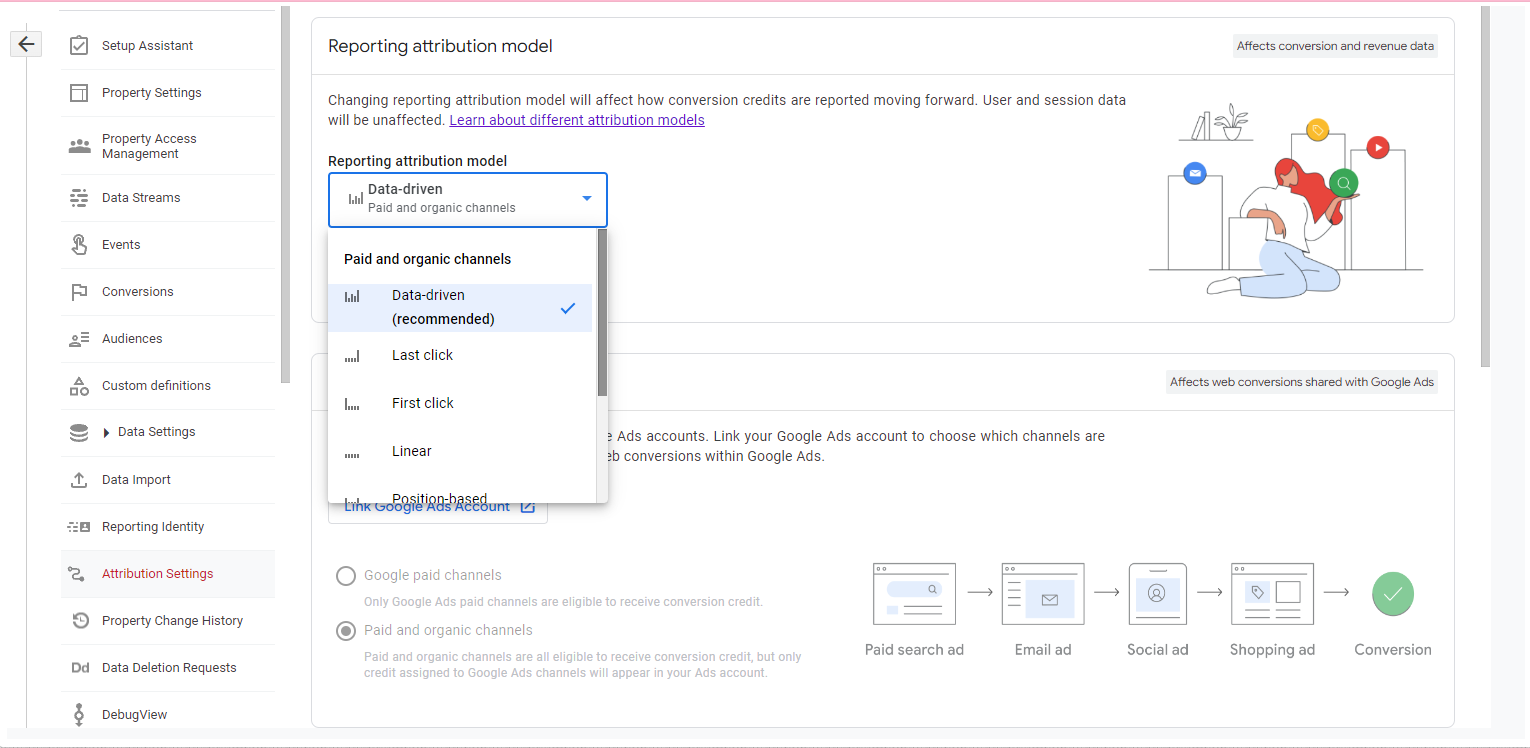
But it’s worth noting that it can be changed at any time, and this change is retroactive (i.e., it will also change the historical data). This way, you can choose any of the available attribution models without losing historical data.
If you aim to make your attribution as close to how it was in UA as possible, select Last Click (Paid and organic channels). And don’t be confused by the name – Paid and organic last click and Last non-direct click are two names for the same attribution model.
Data-driven attribution
Data-driven attribution distributes credit for the conversion based on data for each conversion event. It’s different from the other models because it uses your account’s data to calculate the actual contribution of each click interaction.
Attribution uses machine learning algorithms to evaluate both converting and non-converting paths. The resulting Data-driven model learns how different touchpoints impact conversion outcomes. The model incorporates factors such as time from conversion, device type, number of ad interactions, and the type of creative assets.
Using this counterfactual approach, the model contrasts what happened with what could have happened to determine which touchpoints are most likely to drive conversions. The model then attributes conversion credit to these touchpoints based on this likelihood.
Along with this, there are new dimensions in GA4 that deal with attribution, no matter what attribution you choose at the GA4 property level. For example, there is First user source.
The First user source dimension (source of the first visit) is a new dimension in GA4, and it shows where the user came from to the website or app for the first time. It is part of Google’s new approach to measurement in online marketing, which no longer focuses only on the classic ROAS (revenues vs. costs), but also analyzes the CAC vs. LTV (customer acquisition cost vs. lifetime value).
This approach reflects the app logic: we have to acquire the app user first, and after the app is installed, our further marketing efforts will engage and monetize the user.
The new customer acquisition goal in Google Ads, available in Performance Max campaigns, also represents a similar approach. In this case, the focus is on the first-time buyer, not the first visit.
In GA4, the first user visit is recorded by the first_visit event for the website or the first_open event for the app – the naming here is self-explanatory. Therefore, the source of the first visit is a user attribute and indicates where this user’s first visit to the website or application came from.